To Everything There is a Season
- RBOB futures are approaching an important window
- Seasonal patterns persist despite short-term fundamental issues
- Gasoline marketers should begin considering hedges for Q1 & Q2 now
- Weakness in Asian LNG prices may ripple through global market
Sincerely,
David Thompson, CMT
Executive Vice President
Powerhouse
(202) 333-5380

The Matrix
NYMEX RBOB gasoline futures are nearing the time of year when they often reach an inflection point. The November/December period offers a critical window for gasoline marketers as they plan for Q1 and Q2 of the following year.
The graph below shows the weekly variation from the average price for the year. This pattern has persisted through COVID, wars, inflation, and tariffs. While those events impact the price of gasoline, this larger seasonal trend is driven by a confluence of demand patterns and refinery maintenance cycles.
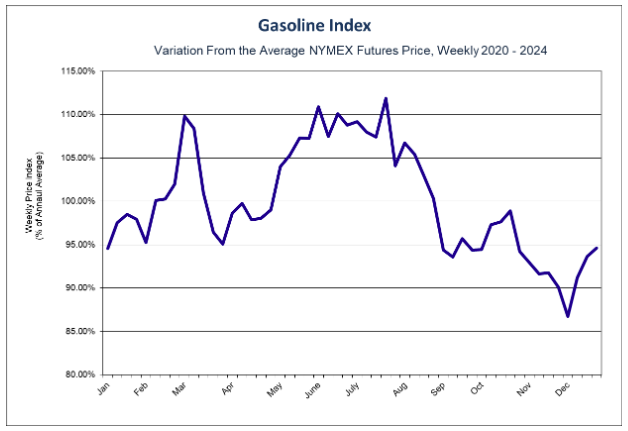
This year has largely followed the seasonal pattern. RBOB futures reached their highwater mark in June and have since chopped steadily lower. As a spate of refinery issues are resolved and other units complete their autumn maintenance, the market could still see additional downward price pressure. This would be a welcome development for gasoline marketers as it creates an improved entry point for establishing hedges designed to protect gross profit margins against the squeeze that typically develops through the first several months of the year.
A glut of crude oil supply hitting the market or refiners maintaining higher than expected run rates could alter the seasonal pattern. POWERHOUSE is monitoring these dynamics closely.
POWERHOUSE can offer help and guidance in developing a hedging program if your gasoline business suffers a squeeze in gross profits over the course of Q1 and Q2.
Supply/Demand Balances
Supply/demand data in the United States for the week ended October 17, 2025, were released by the Energy Information Administration.
Total commercial stocks of petroleum decreased (⬇) 4.2 million barrels to 1.2846 billion barrels during the week ended October 17th, 2025.
Commercial crude oil supplies in the United States were lower (⬇) by 1.0 million barrels from the previous report week to 422.8 million barrels.
Crude oil inventory changes by PAD District:
PADD 1: Down (⬇) 0.5 million barrels to 7.6 million barrels
PADD 2: Down (⬇) 0.4 million barrels to 101.6 million barrels
PADD 3: Down (⬇) 0.3 million barrels to 244.3 million barrels
PADD 4: Up (⬆) 0.4 million barrels to 23.5 million barrels
PADD 5: Down (⬇) 0.2 million barrels to 45.8 million barrels
Cushing, Oklahoma, inventories were down (⬇) 0.8 million barrels to 21.2 million barrels.
Domestic crude oil production decreased (⬇) 7,000 barrels per day from the previous report to 13.629 million barrels per day.
Crude oil imports averaged 5.918 million barrels per day, a daily increase (⬆) of 393,000 barrels. Exports decreased (⬇) 263,000 barrels daily to 4.203 million barrels per day.
Refineries used 88.6% of capacity; an increase (⬆) of 2.9% from the previous report week.
Crude oil inputs to refineries increased (⬆) 600,000 barrels daily; there were 15.730 million barrels per day of crude oil run to facilities. Gross inputs, which include blending stocks, increased (⬆) 522,000 barrels daily to 16.090 million barrels daily.
Total petroleum product inventories decreased (⬇) by 3.2 million barrels from the previous report week, down to 861.8 million barrels.
Total product demand increased (⬆) 289,000 barrels daily to 20.014 million barrels per day.
Gasoline stocks decreased (⬇) 2.1 million barrels from the previous report week; total stocks are 216.7 million barrels.
Demand for gasoline decreased (⬇) 2,000 barrels per day to 8.454 million barrels per day.
Distillate fuel oil stocks decreased (⬇) 115.6 million barrels from the previous report week; distillate stocks are at 115.6 million barrels. EIA reported national distillate demand at 3.847 million barrels per day during the report week, a decrease (⬇) of 386,000 barrels daily.
Propane stocks rose (⬆) 0.8 million barrels from the previous report to 103.2 million barrels. The report estimated current demand at 914,000 barrels per day, an increase (⬆) of 419,000 barrels daily from the previous report week.
Natural Gas
One prominent bank sees the potential for Asian LNG prices to fall over the course of 2026 by as much as 11% versus the current forward curve. Softer Asian demand has freed up cargos for Europe. Approximately 26% of global LNG has gone to the EU over the past 30 days, up from 23% in September and 21% this time last year. The wave of new LNG export capacity is currently projected to exceed demand.
According to the EIA:
- Net injections into storage totaled 87 Bcf for the week ended October 17, compared with the five-year (2020–24) average net injections of 77 Bcf and last year’s net injections of 79 Bcf during the same week. Working natural gas stocks totaled 3,808 Bcf, which is 164 Bcf (5%) more than the five-year average and 34
Bcf (1%) more than last year at this time. - The average rate of injections into storage is 13% higher than the five-year average so far in the refill season (April through October). If the rate of injections into storage matched the five-year average of 7.8 Bcf/d for the remainder of the refill season, the total inventory would be 3,917 Bcf on October 31, which is 164 Bcf higher than the five-year average of 3,753 Bcf for that time of year.
Was this helpful? We’d like your feedback.
Please respond to [email protected]
This material has been prepared by a sales or trading employee or agent of Powerhouse Brokers, LLC and is, or is in the nature of, a solicitation. This material is not a research report prepared by Powerhouse Brokers, LLC. By accepting this communication, you agree that you are an experienced user of the futures markets, capable of making independent trading decisions, and agree that you are not, and will not, rely solely on this communication in making trading decisions.
DISTRIBUTION IN SOME JURISDICTIONS MAY BE PROHIBITED OR RESTRICTED BY LAW. PERSONS IN POSSESSION OF THIS COMMUNICATION INDIRECTLY SHOULD INFORM THEMSELVES ABOUT AND OBSERVE ANY SUCH PROHIBITION OR RESTRICTIONS. TO THE EXTENT THAT YOU HAVE RECEIVED THIS COMMUNICATION INDIRECTLY AND SOLICITATIONS ARE PROHIBITED IN YOUR JURISDICTION WITHOUT REGISTRATION, THE MARKET COMMENTARY IN THIS COMMUNICATION SHOULD NOT BE CONSIDERED A SOLICITATION.
The risk of loss in trading futures and/or options is substantial and each investor and/or trader must consider whether this is a suitable investment. Past performance, whether actual or indicated by simulated historical tests of strategies, is not indicative of future results. Trading advice is based on information taken from trades and statistical services and other sources that Powerhouse Brokers, LLC believes are reliable. We do not guarantee that such information is accurate or complete and it should not be relied upon as such. Trading advice reflects our good faith judgment at a specific time and is subject to change without notice. There is no guarantee that the advice we give will result in profitable trades.
Copyright 2025 Powerhouse Brokers, LLC, All rights reserved