Crude Oil in Bull Phase: $100 Possible?
- WTI crude oil prices moving higher despite growing U.S. production
- Texas output constrained by insufficient infrastructure
- Global crude oil supply constrained
- Natural gas breaks out: $3.50 objective?

The Matrix
WTI crude oil futures have been moving higher despite domestic production of more than eleven million barrels daily. There is a difference between production and availability at consumption locations like refineries or export facilities that could explain why.
Much of the new American production is in Texas’ Permian Basin. The Basin now produces more than 3.4 million barrels daily. Output has doubled in the past three years but supporting infrastructure development has lagged.
Existing regional pipelines are full. Some producers have taken to using trucks and rail cars as supplemental haulage, adding to costs. Others have chosen to defer new development, artificially limiting supply. Other support shortages are hitting labor, water, and even sand. Many wells are being left drilled but uncompleted. EIA reports that 3,630 uncompleted Permian wells in August represents an 80 per cent increase year-on-year.
Without such constraints, one engineering firm has estimated, Permian production could be 4.1 million barrels per day in 2019. As it is, output could be 3.9 million barrels daily, a significant shortfall.
Limited availability of U.S. crude oil comes at a time when OPEC seems unlikely to provide any substantial increments of crude. OPEC officials are skeptical that the group would be able to make up losses. The skepticism reflects both engineering probabilities and political will. Either way, adding to OPEC production would bring the cartel’s capabilities closer to productive crude oil capacity and its bullish implications.
Uncertainties are rife: No one is sure how great the possibilities of lost output might be in places like Iran, Venezuela, Libya or Nigeria. If Iran had to discontinue all exports of 2.7 million daily barrels and Libya lost 600,000 barrels per day – as it did in June, a ten per cent increase would be needed as an offset.
Some analysts now think, given possibilities of substantial supply shortfalls, that crude oil could revisit $100 per barrel. This level has not been seen since July, 2014. This would also be nearly a perfect 61.8 per cent retracement of the drop from $147 in WTI crude oil from July, 2008.
Supply/Demand Balances
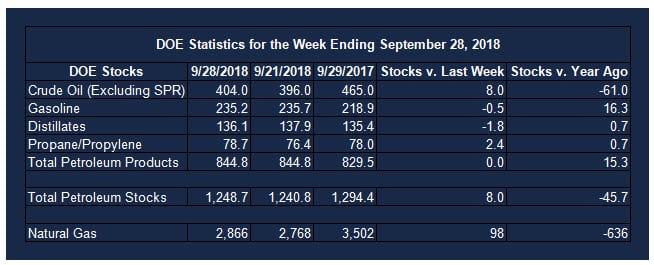
Supply/demand data in the United States for the week ending September 28, 2018 were released by the Energy Information Administration.
Total commercial stocks of petroleum rose 8.0 million barrels during the week ending September 28, 2018.
There were draws in stocks of gasoline, K-jet fuel, distillates, and residual fuel. There were builds in stocks of fuel ethanol, propane, and other oils.
Commercial crude oil supplies in the United States increased to 404.0 million barrels, a build of 8.0 million barrels.
Crude oil supplies increased in three of the five PAD Districts. PAD District 1 (East Coast) stocks rose 0.1 million barrels, PADD 2 (Midwest) stocks were up 3.6 million barrels, and PADD 3 (Gulf Coast) stocks gained 6.6 million barrels. PADD 4 (Rockies) crude oil stocks decreased 0.8 million barrels and PADD 5 (West Coast) stocks declined 1.4 million barrels.
Domestic crude oil production was unchanged from the previous report week at 11.1 million barrels per day.
Crude oil imports averaged 7.965 million barrels per day, a daily increase of 163,000 barrels per day. Exports decreased 917,000 barrels daily to 1.723 million barrels per day.
Refineries used 90.4 per cent of capacity, unchanged from the previous report week.
Crude oil inputs to refineries increased 77,000 barrels daily; there were 16.591 million barrels per day of crude oil run to facilities. Gross inputs, which include blending stocks, declined 8,000 barrels daily to 16.808 million barrels daily.
Total petroleum product inventories was unchanged from the previous report week.
Gasoline stocks decreased 0.5 million barrels from the previous report week; total stocks are 235.2 million barrels.
Demand for gasoline increased 115,000 barrels per day to 9.102 million barrels per day.
Total product demand increased 175,000 barrels daily to 20.174 million barrels per day.
Distillate fuel oil stocks decreased 1.8 million barrels from the previous report week; distillate stocks are 136.1 million barrels. National distillate demand was reported at 3.877 million barrels per day during the report week. This was a weekly decrease of 414,000 barrels daily.
Propane stocks rose 2.4 million barrels from the previous report week; propane stock are 78.7 million barrels. Current demand is estimated at 0.876 million barrels per day, an increase of 10,000 barrels daily from the previous report week.
Natural Gas
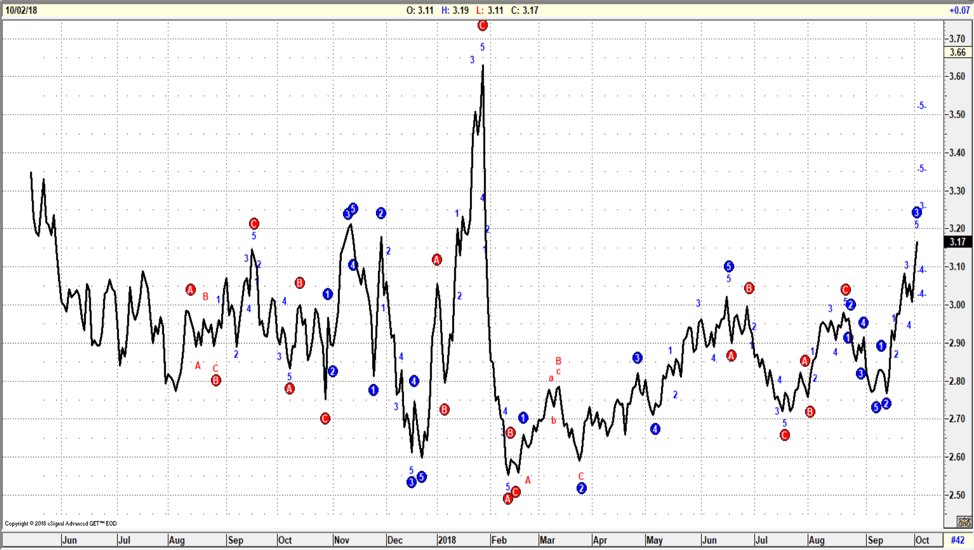
Spot natural gas futures have languished below $3.00 for most of 2018. Spot futures were worth $2.75 on September 14th. By October 3rd, spot prices reached $3.26 – a 13 session gain of 51 cents. There was no obvious reason for such a gain and some observers expressed disdain for the increase, doubling down on shorts. They listed fundamentals like low natural gas to coal spreads or a below EIA End of Season Index as being insufficient indicators for the rally.
As a trading matter, looking for rationale in an emotionally driven market is frustrating at best and unproductive at least. Analyses that consider the role of emotion in pricing turned bullish. Elliott Wave charts now point higher, with prices moving potentially to $3.50.
According to the Energy Information Administration:
Net injections are higher than the five-year average. Net injections into storage totaled 98 Bcf for the week ending September 28, compared with the five-year (2013–17) average net injections of 84 Bcf and last year’s net injections of 44 Bcf during the same week. Working gas stocks totaled 2,866 Bcf, which is 607 Bcf lower than the five-year average and 636 Bcf lower than last year at this time.
Working gas stocks’ deficit to the five-year average decreases. The average rate of net injections into storage is 15% lower than the five-year average so far in the 2018 refill season, which covers April through October. If the rate of injections into working gas matched the five-year average of 10.4 Bcf/d for the remainder of the refill season, total inventories would be 3,208 Bcf on October 31, which is 607 Bcf lower than the five-year average of 3,815 Bcf.
Futures trading involves significant risk and is not suitable for everyone. Transactions in securities futures, commodity and index futures and options on future markets carry a high degree of risk. The amount of initial margin is small relative to the value of the futures contract, meaning that transactions are heavily “leveraged”. A relatively small market movement will have a proportionately larger impact on the funds you have deposited or will have to deposit: this may work against you as well as for you. You may sustain a total loss of initial margin funds and any additional funds deposited with the clearing firm to maintain your position. If the market moves against your position or margin levels are increased, you may be called upon to pay substantial additional funds on short notice to maintain your position. If you fail to comply with a request for additional funds within the time prescribed, your position may be liquidated at a loss and you will be liable for any resulting deficit. Past performance may not be indicative of future results. This is not an offer to invest in any investment program.
Powerhouse is a registered affiliate of Coquest, Inc.
Was this helpful? We’d like your feedback.
Please respond to [email protected]
Copyright © 2018 Powerhouse, All rights reserved.


