United States Now Largest Producer in the World
- Crude oil exports more than 20% of US production
- New risk management tools available for Gulf Coast crude
- Facilities needed for viable export infrastructure
- Natural gas deficit to five-year average storage


The Matrix
American crude oil exports have steadily increased in the three years since exports were again permitted after a long hiatus. Exports of crude oil from the United States for the four weeks ending October 26, 2018 averaged 2.3 million barrels daily. This amounted to more than twenty per cent of domestic production during that time. Moreover, it points to an important movement toward internationalization of the American oil industry.
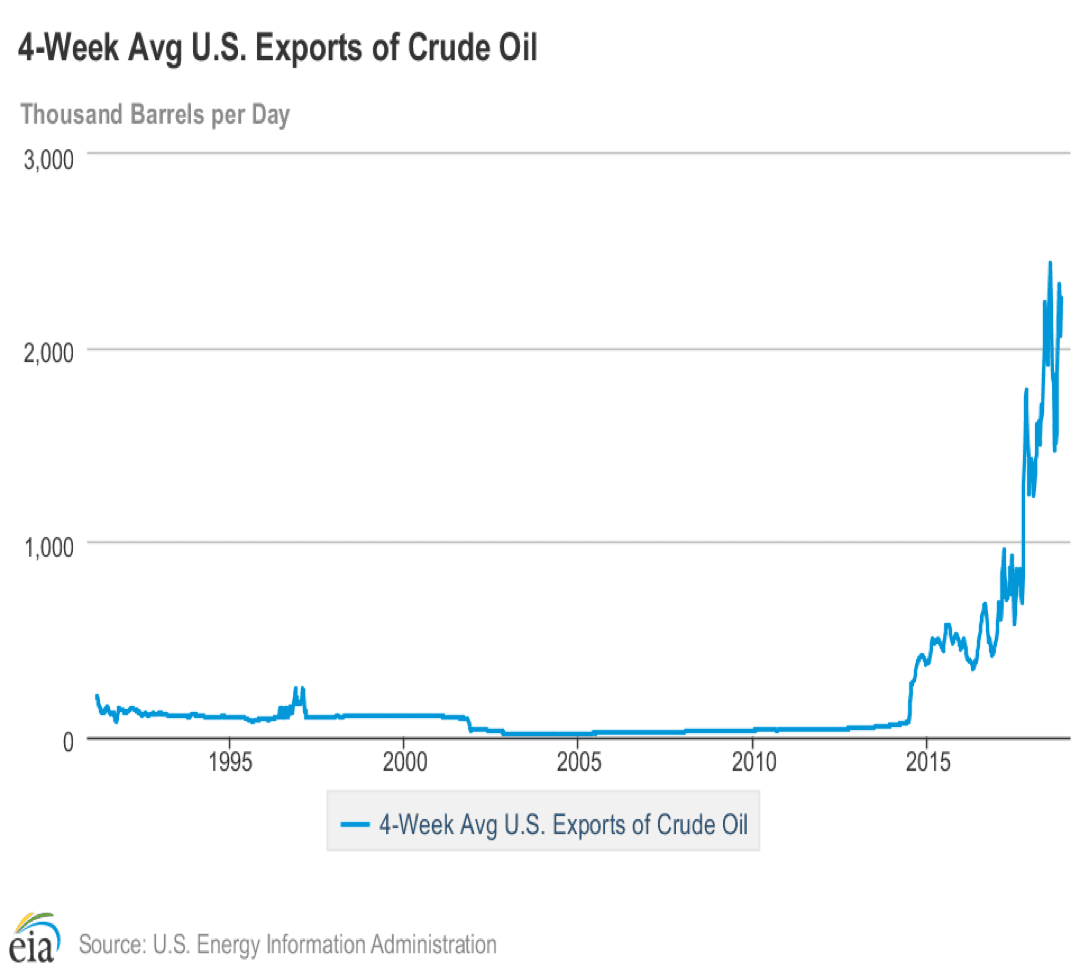
Avg US Exports of Crude Oil 1990 – 2018 Source: EIA
Futures markets have developed new instruments to provide hedge protection for production destined for overseas markets. One is a crude oil futures contract with delivery based on Houston prices, not values at Cushing. There is another basis swap contract using the difference between Brent and WTI. It is often difficult to build volume in a new hedging instrument, and these contracts may face the same challenge. Nonetheless, these contracts demonstrate the flexibility available through risk management.
Further export growth could be hindered by shortages of infrastructure. Gulf Coast export facilities are in short supply. As pipeline connections to fields in West Texas come online, efforts to build export facilities are likely to ramp up. Efforts are already underway in Corpus Christi to accommodate deeper draft vessels. Other facilities are said to be under discussion all along the coast. Exports could be directed to Asia, Latin America and Europe.
Interest in new Gulf Coast export facilities reflects the continuing expansion of American crude oil production. The Energy Information Administration reported U.S. monthly crude oil production exceeded eleven million barrels daily in August, reaching 11.3 million barrels per day.

US Field Production Crude 1920 – 2018 Source: EIA
This was the first time that monthly U.S. output exceeded eleven million barrels daily. Russia estimated its August production at 11.2 million barrels per day. This made the United States the leading oil producer in the world.
Regionally, Texas had the highest record level at 4.6 million barrels per day, followed by North Dakota at 1.3 million barrels daily. These volumes exceeded EIA expectations, reflecting “industry efficiencies in pipeline utilization and increased trucking and rail transport.”
Supply/Demand Balances
Supply/demand data in the United States for the week ending October 26, 2018 were released by the Energy Information Administration.
Total commercial stocks of petroleum declined 6.4 million barrels during the week ending October 26, 2018.
There were draws in stocks of gasoline, fuel ethanol, K-jet fuel, distillates, residual fuel, and other oils. There was a build in stocks of propane.
Commercial crude oil supplies in the United States increased to 426.0 million barrels, a build of 3.2 million barrels.
Crude oil supplies increased in three of the five PAD Districts. PAD District 2 (Midwest) stocks increased 3.0 million barrels, PADD 4 (Rockies) stocks were up 0.4 million barrels, and PADD 5 (west Coast) stocks rose 1.0 million barrels. PADD 3 (Gulf Coast) stocks fell 1.1 million barrels from the previous report week. PADD 1 (East Coast) stocks were unchanged from the previous report week.
Cushing, Oklahoma inventories increased 1.9 million barrels from the previous report week to 31.9 million barrels.
Domestic crude oil production was up 300,000 barrels per day from the previous report week to 11.2 million barrels per day.
Crude oil imports averaged 7.344 million barrels per day, a daily decrease of 334,000 barrels per day. Exports rose 305,000 barrels daily to 2.485 million barrels per day.
Refineries used 89.4 per cent of capacity, an increase of 0.2 percentage points from the previous report week.
Crude oil inputs to refineries increased 149,000 barrels daily; there were 16.417 million barrels per day of crude oil run to facilities. Gross inputs, which include blending stocks, increased 34,000 barrels daily to 16.625 million barrels daily.
Total petroleum product inventories fell 3.2 million barrels from the previous report week.
Gasoline stocks decreased 3.2 million barrels from the previous report week; total stocks are 226.2 million barrels.
Demand for gasoline decreased 62,000 barrels per day to 9.262 million barrels per day.
Total product demand decreased 493,000 barrels daily to 20.997 million barrels per day.
Distillate fuel oil stocks decreased 4.1 million barrels from the previous report week; distillate stocks are 126.3 million barrels. National distillate demand was reported at 4.426 million barrels per day during the report week. This was a weekly increase of 420,000 barrels daily.
Propane stocks increased 1.0 million barrels from the previous report week; propane stock are 83.0 million barrels. Current demand is estimated at 1.382 million barrels per day, a decrease of 26,000 barrels daily from the previous report week.
Natural Gas
According to the Energy Information Administration:
Net injections are lower than the five-year average. Net injections into storage totaled 48 Bcf for the week ending October 26, compared with the five-year (2013–17) average net injections of 62 Bcf and last year’s net injections of 65 Bcf during the same week. Working gas stocks totaled 3,143 Bcf, which is 638 Bcf lower than the five-year average and 623 Bcf lower than last year at this time.
Working gas stocks’ deficit to the five-year average increases, and the deficit to the bottom of the five-year range also increases. The average rate of net injections into storage is 14% lower than the five-year average so far in this refill season (April through October). If the rate of injections into storage matched the five-year average for the remainder of the refill season, total inventories would be 3,177 Bcf on October 31, which is 638 Bcf lower than the five-year average of 3,815 Bcf for that time of year.
Futures trading involves significant risk and is not suitable for everyone. Transactions in securities futures, commodity and index futures and options on future markets carry a high degree of risk. The amount of initial margin is small relative to the value of the futures contract, meaning that transactions are heavily “leveraged”. A relatively small market movement will have a proportionately larger impact on the funds you have deposited or will have to deposit: this may work against you as well as for you. You may sustain a total loss of initial margin funds and any additional funds deposited with the clearing firm to maintain your position. If the market moves against your position or margin levels are increased, you may be called upon to pay substantial additional funds on short notice to maintain your position. If you fail to comply with a request for additional funds within the time prescribed, your position may be liquidated at a loss and you will be liable for any resulting deficit. Past performance may not be indicative of future results. This is not an offer to invest in any investment program.
Powerhouse is a registered affiliate of Coquest, Inc.
Was this helpful? We’d like your feedback.
Please respond to [email protected]
Copyright© 2018 Powerhouse, All rights reserved.