U.S. Sources of Crude Oil Supply at Question
- U.S. production of crude oil has grown
- Drilled but uncompleted wells (DUCs) falling
- Pre-COVID-19 production not close
- Natural gas injection season ends at 3.6 Tcf

Alan Levine—Chairman, Powerhouse
(202) 333-5380
The Matrix
Builds in commercial crude oil supplies were not enough to alleviate concern over the adequacy of crude oil availability to refiners. Overseas, OPEC+ agreed to continue its planned increase of 400,000 barrels daily per month—not enough to meet demand now unsatisfied by the supply chain crunch inhibiting economic growth. As discussed in the Weekly Economic Market Situation recently, shortfalls in Nigeria and Angola have cut into the OPEC+ planned delivery.
Production in the United States has grown. EIA’s Petroleum Balance Sheet for the week ended October 29, 2021, reported an increase of 200,000 barrels per day. Now at 11.5 million daily barrels, production has hit its highest level since August 2020 when output fell to 9.7 million barrels per day. The higher level should help offset the failure of OPEC+ to deliver on its planned output in December.
The Energy Information Administration now includes the number of DUCs in seven Drilling Productivity Report regions. This provides a consistent source of data on such wells and their output.
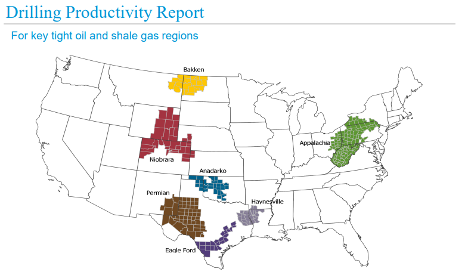
Key Light Oil and Shale Gas Regions in U.S. Source: EIA
Domestic production of crude oil comes from new wells and output from wells drilled but uncompleted (DUCs). DUCs provide a sort of secondary crude oil inventory. As the number of DUCs falls, it suggests a source of not-replaceable supply. EIA estimated that there was 4,117 End-of-August DUCs in the four oil-dominant regions: Bakken, Eagle Ford, Niobrara and Permian. (Natural gas regions, Haynesville, Marcellus and Utica had 914 DUCs.)
EIA estimates the four oil regions showed increased DUCs in 2014 and 2015. The count has decreased by about 400 over the five months preceding September.
EIA says, “The full completion process involves casing, cementing, perforating, hydraulic fracturing, and other procedures to make the well ready to begin producing oil or natural gas. Following the large decline in oil prices since mid-2014, new drilling and completion activity slowed, and the number of DUCs in oil-dominant regions increased. A high inventory of DUCs has implications for the size and timing of the domestic supply response to changes in oil prices, with or without significant changes in the number of active drilling rigs. (Emphasis added by Powerhouse.)
A return to full pre-COVID-19 output of 13 million barrels per day of domestic production remains a way off. It is doubtful that DUCs will be able to fill in the gap.
Supply/Demand Balances
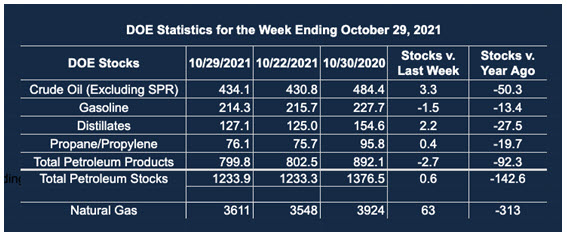
Supply/demand data in the United States for the week ended Oct. 29, 2021, were released by the Energy Information Administration.
Total commercial stocks of petroleum rose 0.6 million barrels during the week ended Oct. 29, 2021.
Commercial crude oil supplies in the United States increased by 3.3 million barrels from the previous report week to 434.1 million barrels.
Crude oil inventory changes by PAD District:
PADD 1: Plus 0.2 million barrels to 8.4 million barrels
PADD 2: Plus 1.0 million barrels to 106.5 million barrels
PADD 3: Plus 1.9 million barrels to 249.3 million barrels
PADD 4: Plus 0.4 million barrels to 23.6 million barrels
PADD 5: Down 0.4 million barrels to 46.2 million barrels
Cushing, Oklahoma, inventories were down 0.9 million barrels from the previous report week to 26.4 million barrels.
Domestic crude oil production increased 200,000 barrels daily from the previous report week at 11.5 million barrels daily.
Crude oil imports averaged 6.127 million barrels per day, a decrease of 83,000 barrels daily. Exports rose 138,000 barrels daily to 2.925 million barrels per day.
Refineries used 86.3% of capacity; 1.2 percentage points higher than the previous report week.
Crude oil inputs to refineries fell 25,000 barrels daily; there were 15.023 million barrels per day of crude oil run to facilities. Gross inputs, which include blending stocks, rose 213,000 barrels daily to 15.646 million barrels daily.
Total petroleum product inventories dropped 2.7 million barrels from the previous report week.
Gasoline stocks decreased by 1.5 million barrels from the previous report week; total stocks are 214.3 million barrels.
Demand for gasoline rose 181,000 barrels per day to 9.503 million barrels per day.
Total product demand added 0.166 million barrels daily to 19.997 million barrels per day.
Distillate fuel oil stocks added 2.2 million barrels from the previous report week; distillate stocks are at 127.1 million barrels. EIA reported national distillate demand at 3.686 million barrels per day during the report week, a decrease of 183,000 barrels daily.
Propane stocks increased 0.4 million barrels from the previous report week; propane stocks are at 76.1 million barrels. The report estimated current demand at 1.282 million barrels per day, an increase of 302,000 barrels daily from the previous report week.
Natural Gas
The natural gas injection season has ended. Underground storage of 3.6 Tcf is enough to ease concerns over availability this winter, especially with cold weather expectations easing. Futures contract prices flattened for the balance of winter.
According to the EIA:
Net [natural gas] injections into storage totaled 63 Bcf for the week ending October 29, compared with the five-year (2016–2020) average net injections of 38 Bcf and last year’s net withdrawals of 27 Bcf during the same week. Working natural gas stocks totaled 3,611 Bcf, which is 101 Bcf lower than the five-year average and 313 Bcf lower than last year at this time.
Was this helpful? We’d like your feedback.
Please respond to [email protected]
Powerhouse Futures & Trading Disclaimer
Copyright 2021 Powerhouse Brokerage, LLC, All rights reserved