

Gasoline Demand Fails Seasonal Pattern
- Gasoline demand improves versus year ago, but lags pre-pandemic levels
- Retail fuel profit margins return to historical average
- Some new refining capacity enters the market
- Natural gas gains share of power generation from coal
Sincerely,
Alan Levine, Chairman
Powerhouse
(202) 333-5380
The Matrix
Petroleum product prices rallied at the end of last week, reflecting the decline in product supply, notably distillate fuel oil (-1.2 million barrels) and propane (-0.6 million barrels). Gasoline prices moved higher, despite a 1.7-million-barrel gain in supply. Petroleum demand fell during the week ended April 28 by 400,000 barrels daily. Gasoline consumption fell nearly 900,000 barrels per day to 8.6 million daily barrels. This largely reversed a 922,000 barrel per day increase in the prior report.
The ongoing push & pull dynamic of the attempted Chinese economic re-opening versus the U.S. Federal Reserve’s campaign to cool inflation continues to dominate the global macroeconomic debate.
Gasoline demand still lags pre-pandemic levels by high single digit to high teens in percentage terms depending on the source (EIA versus OPIS, for example). This is despite the fact front-month RBOB futures contracts are trading nearly $1.35 per gallon less than year-ago levels. However, in March 2023, U.S. gasoline demand did surpass 2022 levels (on a year over year comparison).

It is important to note that last week’s sell-off in RBOB futures price held key support of $2.25 per gallon (referencing the June contract). However, traditional seasonal factors suggest that gasoline bulls run out of steam as Memorial Day approaches.
Retail gasoline marketers have lived through truly Dickensian (the best & worst of) times over the last three years. The last six months have seen the profit margins on retail fuel move sharply back towards the national average for the last five years.
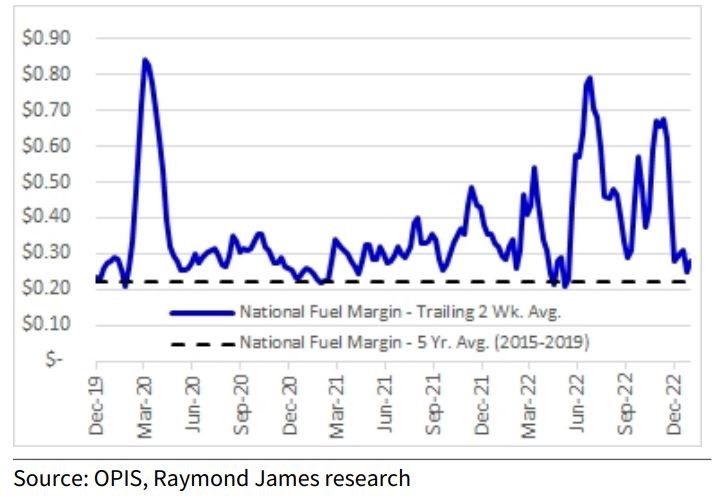
A return to historical norms in profit margins will likely reinforce the importance of protecting against the seasonal, gross revenue squeezes that hit retail gasoline and diesel marketers each year.
The trade press has noted the additions to refining capacity both domestically and abroad. While the upgraded refinery at Beaumont, TX has added roughly 250,000 b/d of new nameplate capacity, overseas developments should be watched carefully. Nigeria has announced the ‘inauguration’ of the 650,000 b/d Dangote refinery. However, refining experts suspect that little finished product will reach the market this year. Similarly, new refinery projects in Kuwait and Saudi Arabia have seen numerous delays.
Supply/Demand Balances
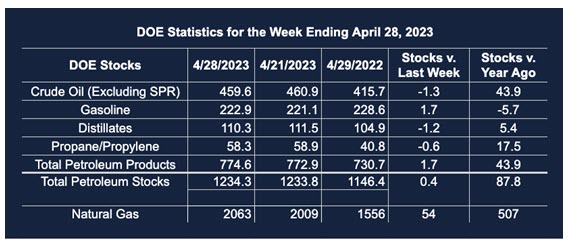
Supply/demand data in the United States for the week ended April 28, 2023, were released by the Energy Information Administration.
Total commercial stocks of petroleum rose (⬆) 0.4 million barrels to 1.2343 billion barrels during the week ended April 28, 2023.
Commercial crude oil supplies in the United States were lower (⬇) by 1.3 million barrels from the previous report week to 459.6 million barrels.
Crude oil inventory changes by PAD District:
PADD 1: Down (⬇) 0.1 at 7.5 million barrels
PADD 2: Up (⬆) 2.1 million barrels to 120.0 million barrels
PADD 3: Down (⬇) 5.0 million barrels to 254.9 million barrels
PADD 4: Up (⬆) 0.3 million barrels to 25.5 million barrels
PADD 5: Up (⬆) 1.4 million barrels to 51.7 million barrels
Cushing, Oklahoma, inventories were Up (⬆) 0.5 million barrels from the previous report week to 33.6 million barrels.
Domestic crude oil production was up (⬆) 100,000 barrels at 12.3 million barrels daily.
Crude oil imports averaged 6.396 million barrels per day, a daily increase (⬆) of 21,000 barrels. Exports decreased (⬇) 82,000 barrels daily to 4.737 million barrels per day.
Refineries used 90.7% of capacity; 0.6 percentage points lower (⬇) than the previous report week.
Crude oil inputs to refineries decreased (⬇) 98,000 barrels daily; there were 15.735 million barrels per day of crude oil run to facilities. Gross inputs, which include blending stocks, decreased (⬇) 105,000 barrels daily to 16.378 million barrels daily.
Total petroleum product inventories rose (⬆) by 1.8 million barrels from the previous report week, up to 774.7 million barrels.
Total product demand decreased (⬇) 403,000 barrels daily to 19.805 million barrels per day.
Gasoline stocks increased (⬆) 1.7 million barrels from the previous report week; total stocks are 222.9 million barrels.
Demand for gasoline decreased (⬇) 893,000 barrels per day to 8.618 million barrels per day.
Distillate fuel oil stocks decreased (⬇) 1.2 million barrels from the previous report week; distillate stocks are at 110.3 million barrels. EIA reported national distillate demand at 3.872 million barrels per day during the report week, an increase (⬆) of 144,000 barrels daily.
Propane stocks decreased (⬇) by 0.6 million barrels from the previous report week to 58.3 million barrels. The report estimated current demand at 1.105 million barrels per day, an increase (⬆) of 429,000 barrels daily from the previous report week.
Natural Gas
Spot futures prices for Henry Hub natural gas retreated from their attempt to break resistance at $2.41 early last week. They ended the week at $2.137, rejecting an attempt to move below $2.00. Stochastics are technical indicator used to evaluate whether a commodity’s price is oversold. The stochastics reading for natural gas futures reached a level of 18, suggesting a bounce may be at hand. But nothing in the general market such as weather or shifts in physical balances particularly supports this view.
The importance of natural gas as the fuel of choice seems secure as the United States shifts from fossil fuels to renewables. The Energy Information Administration provided data on the displacement of coal by natural gas for power generation.
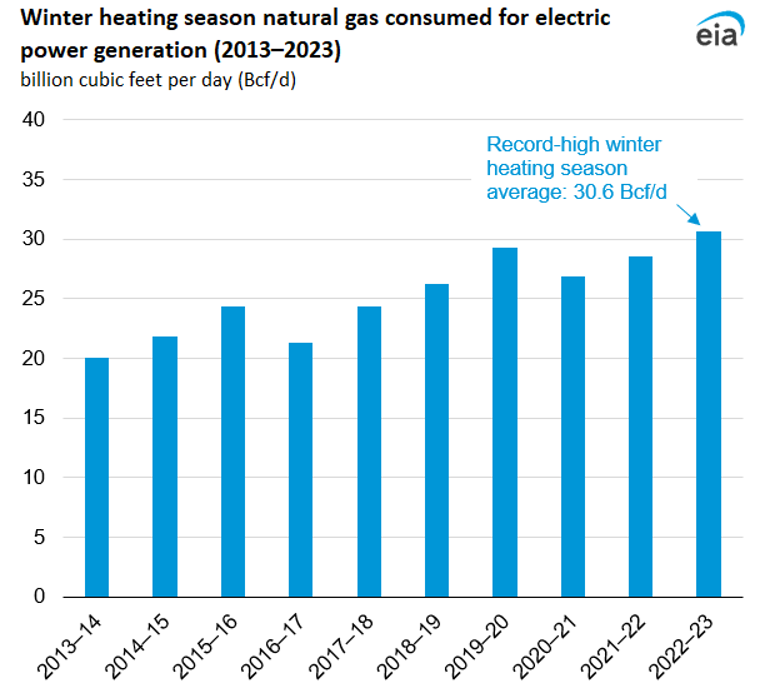
The previous heating season, ended March 31, reported natural gas consumption for power generation of 30.6 Bcf/d. This was the highest winter seasonal use on record. It follows a path of growing natural gas use since 2017, as coal-fired generation has been lost.
Coal-fired plants have been retired, and no new coal-fired capacity has emerged since 2013. EIA notes that 11.5 gigawatts of coal-fired generating capacity was retired in the U.S. in 2022.
Natural gas generated 37.7% of 2022-2023 winter electric, up from 35.2% in the previous year. Generation from coal was 17.8%, down 2.8 percentage points from the yar before.
According to the EIA:
The net [natural gas] injections into storage totaled 54 Bcf for the week ended April 28, compared with the five-year (2018–2022) average net injections of 78 Bcf and last year’s net injections of 72 Bcf during the same week. Working natural gas stocks totaled 2,063 Bcf, which is 341 Bcf (20%) more than the five-year average and 507 Bcf (33%) more than last year at this time.
According to The Desk survey of natural gas analysts, estimates of the weekly net change to working natural gas stocks ranged from net injections of 46 Bcf to 60 Bcf, with a median estimate of 53 Bcf.
Was this helpful? We’d like your feedback.
Please respond to [email protected]
Powerhouse Futures & Trading Disclaimer
Copyright 2023 Powerhouse Brokerage, LLC, All rights reserved


