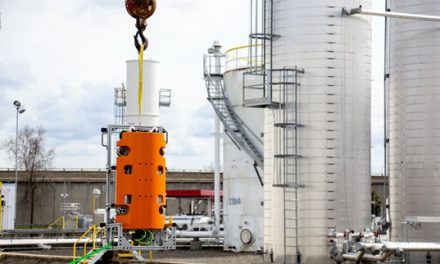
Global Reach of U.S. Oil Grows
- U.S. crude oil output expected to exceed 10 million barrels daily
- Easing regulations on offshore drilling could add even more to production
- Exports of crude oil and petroleum products growing dramatically
- Natural gas supplies lag last year by 14%
 Sincerely,
Alan Levine, Chairman of Powerhouse

The Matrix
Market chatter about American energy independence may be in the rear-view mirror. The impact of fracking on secure domestic supply, the growth of exports and the implications of easing regulations on drilling are raising the possibility that the United States could be on its way to commanding global energy markets.

Growing efficiencies in fracturing have caused analysts to rethink expectations of ultimate crude oil available in the United States. The Energy Information Administration (EIA) reports that U.S. crude oil production averaged an estimated 8.9 million barrels per day (b/d) in 2016. U.S. crude oil production was forecast to average 9.2 million b/d in 2017 and 9.9 million b/d in 2018. A private forecast projects a record 10.24 million barrels daily by end-2018, representing a 17% increase in output.
This expectation of expanding domestic crude oil availability through greater efficiencies may not be enough to define the total amount of new production coming to market. The prospect of easing regulations that now inhibit production could contribute even more supply to the market.
The Department of the Interior (DOI) has ordered a new five-year plan for development of less regulatory-intrusive offshore exploration. The plan directs immediate Outer Continental Shelf leasing programs. These would ease entry into drilling off Alaska, the East Coast and the Gulf of Mexico.

Exports of crude oil and petroleum products are expanding the importance of the U.S. in global trade. After many years in which exports were a very small part of petroleum balances, outflow started to become significant around 2010. In that year, exports were 2.3 million barrels daily. They have since more than doubled. Mexico and Canada comprise about a quarter of exports. Exports to China are now around 18 million barrels daily. The U.S. exported 2.8 million barrels daily to China in August of 2016.
Supply/Demand Balances
Supply/demand data in the United States for the week ending April 28, 2017, were released by the EIA.
Total commercial stocks of petroleum increased 1.3 million barrels during the week ending April 28, 2017.
Builds were reported in stocks of gasoline, residual fuel and other oils. Draws were reported in stocks of fuel ethanol, K-jet fuel and distillates. Stocks of propane were unchanged from the previous report week.
Commercial crude oil supplies in the United States decreased to 527.8 million barrels, a draw of 0.9 million barrels.
Crude oil supplies decreased in two of the five PAD Districts. PAD District 1 (East Coast) crude oil stocks fell 1.7 million barrels and PADD 5 (West Coast) stocks declined 2.4 million barrels. PADD 2 (Midwest) stocks increased 1.4 million barrels, PADD 3 (Gulf Coast) stocks expanded 1.5 million barrels and PADD 4 (Rockies) stocks grew 0.2 million barrels.
Cushing, Oklahoma, inventories decreased 0.7 million barrels from the previous report week to 66.7 million barrels.
Domestic crude oil production increased 28,000 barrels daily to 9.293 million barrels per day.
Crude oil imports averaged 8.264 million barrels per day, a daily decrease of 648,000 barrels. Exports fell 614,000 barrels daily to 538,000 barrels per day.
Refineries used 93.3% of capacity, a decrease of 0.8 percentage points from the previous report week.
Crude oil inputs to refineries decreased 108,000 barrels daily; there were 17.177 million barrels per day of crude oil run to facilities. Gross inputs, which include blending stocks, fell 147,000 barrels daily to 17.368 million barrels daily.
Total petroleum product inventories saw an increase of 2.2 million barrels from the previous report week.
Gasoline stocks increased 0.2 million barrels; total stocks are 241.2 million barrels.
Demand for gasoline fell 51,000 barrels per day to 9.156 million barrels daily.
Total product demand increased 784,000 barrels daily to 19.894 million barrels per day.
Distillate fuel oil supply fell 0.6 million barrels to 150.4 million barrels. National distillate demand was reported at 4.256 million barrels per day during the report week. This was a weekly increase of 589,000 barrels daily.
Propane stocks were unchanged from the previous report week at 39.7 million barrels. Current demand is estimated at 1.090 million barrels per day, an increase of 143,000 barrels daily from the previous report week.
Natural Gas
According to the EIA:
Net injections into storage totaled 67 Bcf, compared with the five-year (2012 – 2016) average net injection of 63 Bcf and last year’s net injections of 68 Bcf during the same week. Net injections exceeded the five-year average in the East, Midwest and Mountain regions by 9 Bcf on the week. Elsewhere, net injections fell below the five-year average.
Working gas levels are 14% lower than last year’s record levels, but well ahead of the five-year average. Working gas levels are 359 Bcf lower than last year’s levels at this time
Short-term availability of natural gas will increase over the next few weeks, reflecting closure of part of the Vector pipeline in Michigan. The close is designed to allow interconnection with the 3.25 Bcf/d Rover pipeline, which runs from Pennsylvania to Ontario.
Futures trading involves significant risk and is not suitable for everyone. Transactions in securities futures, commodity and index futures and options on future markets carry a high degree of risk. The amount of initial margin is small relative to the value of the futures contract, meaning that transactions are heavily “leveraged.” A relatively small market movement will have a proportionately larger impact on the funds you have deposited or will have to deposit—this may work against you as well as for you. You may sustain a total loss of initial margin funds and any additional funds deposited with the clearing firm to maintain your position. If the market moves against your position or margin levels are increased, you may be called upon to pay substantial additional funds on short notice to maintain your position. If you fail to comply with a request for additional funds within the time prescribed, your position may be liquidated at a loss and you will be liable for any resulting deficit. Past performance may not be indicative of future results. This is not an offer to invest in any investment program.
Powerhouse is a registered affiliate of Coquest, Inc.
Was this helpful? We’d like your feedback.
Please respond to [email protected].
Copyright © 2017 Powerhouse, All rights reserved.


