Exports Effect Propane and Natural Gas Markets
- U.S. propane production levels continue to set new highs
- The export market is a critical balancer for Mont Belvieu prices
- Major market players are reacting to the Chinese tariff on U.S. LPG
- New LNG export trains coming into service ramp U.S. feed gas demand higher
Sincerely,
David Thompson, CMT
Executive Vice President
Powerhouse
(202) 333-5380
The Matrix
The Energy Information Administration (EIA) recently announced that U.S. propane and propylene production hit a record high of 2.852 million b/d at the end of April.
Exports of U.S. propane now play a central role in balancing both the U.S. and the global propane markets. U.S. exports have averaged 1.869 million b/d so far this year, nearly 5% higher than the average rate of 2024. With over 65% of U.S. production destined to go to offshore buyers, Mont Belvieu propane must now price itself in relation to the export market as opposed to a percentage of crude oil prices.
Despite initial concerns of price disruption caused by China’s imposition of 125% tariffs on U.S. propane, the global market has quickly adapted. With over 300,000 b/d of U.S. propane potentially looking for new buyers, the Abu Dhabi National Oil Company (ADNOC), among other players, stepped in. ADNOC announced it would start buying LPG from the U.S. and use that supply to satisfy customers in India. Their own production could then be shipped tariff-free to China.
India imports even more propane than China but currently buys almost none directly from the U.S. A potential trade deal that includes ramping up the imports of American LPG would once again demonstrate the adaptability and truly global nature of the propane market.
The counter-seasonal rally in Mont Belvieu futures prices in early April appears to have been demand ‘pulled forward’ to avoid tariff charges. As the calendar moves forward, we expect a return to a more typical seasonal price decline into June. However, all market participants should remain vigilant for announcements of trade deals. POWERHOUSE will keep clients appraised.
Supply/Demand Balances
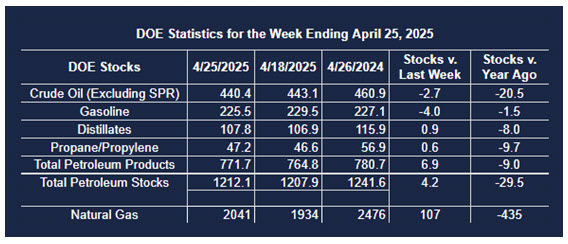
Supply/demand data in the United States for the week ending April 25, 2025, were released by the Energy Information Administration.
Total commercial stocks of petroleum increased (⬆) 4.2 million barrels to 1.2121 billion barrels during the week ending April 25, 2025.
Commercial crude oil supplies in the United States were lower (⬇) by 2.7 million barrels from the previous report week to 440.4 million barrels.
Crude oil inventory changes by PAD District:
PADD 1: Up (⬆) 0.1 million barrels to 8.6 million barrels
PADD 2: Up (⬆) 0.1 million barrels to 108.4 million barrels
PADD 3: Down (⬇) 3.7 million barrels to 249.7 million barrels
PADD 4: Down (⬇) 0.1 million barrels to 24.1 million barrels
PADD 5: Up (⬆) 0.9 million barrels to 49.3 million barrels
Cushing, Oklahoma, inventories were up (⬆) 0.7 million barrels to 25.7 million barrels.
Domestic crude oil production increased (⬆) 5,000 barrels per day from the previous report at 13.465 million barrels per day.
Crude oil imports averaged 5.498 million barrels per day, a daily decrease (⬇) of 90,000 barrels. Exports increased (⬆) 572,000 barrels daily to 4.121 million barrels per day.
Refineries used 88.6 percent of capacity; an increase (⬆) of 0.5 percent from the previous report week.
Crude oil inputs to refineries increased (⬆) 189,000 barrels daily; there were 16.078 million barrels per day of crude oil run to facilities. Gross inputs, which include blending stocks, increased (⬆) 109,000 barrels daily to 16.326 million barrels daily.
Total petroleum product inventories increased (⬆) by 6.9 million barrels from the previous report week, down to 771.7 million barrels.
Total product demand decreased (⬇) 1,720,000 barrels daily to 19.154 million barrels per day.
Gasoline stocks decreased (⬇) 4.0 million barrels from the previous report week; total stocks are 225.5 million barrels.
Demand for gasoline decreased (⬇) 316,000 barrels per day to 9.098 million barrels per day.
Distillate fuel oil stocks increased (⬆) 0.9 million barrels from the previous report week; distillate stocks are at 107.8 million barrels. EIA reported national distillate demand at 3.550 million barrels per day during the report week, a decrease (⬇) of 353,000 barrels daily.
Propane stocks rose (⬆) 0.6 million barrels from the previous report to 47.2 million barrels. The report estimated current demand at 878,000 barrels per day, an increase (⬆) of 431,000 barrels daily from the previous report week.
Natural Gas
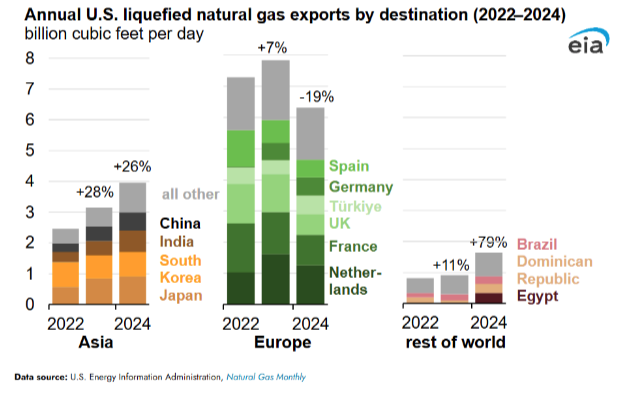
The EIA also commented recently on U.S. LNG exports. They forecast a 4% growth in growth demand in 2025 with an 18% increase in LNG exports. This amount outpaces the expected 9% increase in residential and commercial sectors.
U.S. feed gas demand remained above 16 bcf/d for much of April due to the export facilities at Plaquemines LNG Phase 2 and Corpus Christi Stage 3 ramping up more rapidly than expected.
As noted in a previous edition of the Weekly Energy Market Situation, the flexibility of contract terms for U.S. LNG exports has mitigated the impact of Chinese tariffs on American LNG imports as cargoes once ticketed for China can be resold into new markets.
According to the EIA:
- Net injections into storage totaled 107 Bcf for the week ending April 25, compared with the five-year (2020–24) average net injections of 58 Bcf and last year’s net injections of 64 Bcf during the same week. Working natural gas stocks totaled 2,041 Bcf, which is 5 Bcf (less than 1%) more than the five-year average and 435 Bcf (18%) less than last year at this time.
- According to The Desk survey of natural gas analysts, estimates of the weekly net change to working natural gas stocks ranged from net injections of 92 Bcf to 129 Bcf, with a median estimate of 115 Bcf.
Was this helpful? We’d like your feedback.
Please respond to [email protected]
This material has been prepared by a sales or trading employee or agent of Powerhouse Brokers, LLC and is, or is in the nature of, a solicitation. This material is not a research report prepared by Powerhouse Brokers, LLC. By accepting this communication, you agree that you are an experienced user of the futures markets, capable of making independent trading decisions, and agree that you are not, and will not, rely solely on this communication in making trading decisions.
DISTRIBUTION IN SOME JURISDICTIONS MAY BE PROHIBITED OR RESTRICTED BY LAW. PERSONS IN POSSESSION OF THIS COMMUNICATION INDIRECTLY SHOULD INFORM THEMSELVES ABOUT AND OBSERVE ANY SUCH PROHIBITION OR RESTRICTIONS. TO THE EXTENT THAT YOU HAVE RECEIVED THIS COMMUNICATION INDIRECTLY AND SOLICITATIONS ARE PROHIBITED IN YOUR JURISDICTION WITHOUT REGISTRATION, THE MARKET COMMENTARY IN THIS COMMUNICATION SHOULD NOT BE CONSIDERED A SOLICITATION.
The risk of loss in trading futures and/or options is substantial and each investor and/or trader must consider whether this is a suitable investment. Past performance, whether actual or indicated by simulated historical tests of strategies, is not indicative of future results. Trading advice is based on information taken from trades and statistical services and other sources that Powerhouse Brokers, LLC believes are reliable. We do not guarantee that such information is accurate or complete and it should not be relied upon as such. Trading advice reflects our good faith judgment at a specific time and is subject to change without notice. There is no guarantee that the advice we give will result in profitable trades.
Copyright 2025 Powerhouse Brokers, LLC, All rights reserved