

Strong Demand Developing for Oils
- GDP expands rapidly
- Pent-up demand needs to be satisfied
- Expansion of crude oil supply is slow
- Natural gas edges higher

Alan Levine—Chairman, Powerhouse
(202) 333-5380
The Matrix
The United States has apparently found its economic footing more than a year into the COVID-19 pandemic. Improving economic activity has been supported by steady gains in oil prices. Oil supply remains under restrictions imposed by OPEC and its allies in global crude oil production.
On balance, the pull of consumption, accentuated by pent-up demand for goods and services appears to be in the driver’s seat. The effort of crude oil producers to restrain new supply pushes prices higher.
There are two main streams of new crude oil supply: OPEC+ and U.S. shale oil production. Domestic crude oil output most recently stands at 10.9 million barrels per day. This is higher than shut-in supply, which pushed production to 9.7 million barrels daily this past February. It is also well below recent highs of 13 million daily barrels. U.S. crude oils might not be as reboundable as has been assumed.
OPEC+ have agreed to constrain their collective output to support price. The current deal is expected to last through April 2022. Cuts in production, now around seven million barrels daily, are scheduled to be reduced by 350,000 barrels daily in May and June and an additional 400,000 barrels per day in July.
Expectations are turning bullish for demand. Consumer demand started to expand as stimulus checks were used to buy cars and many other consumer goods early this year. The threat of the COVID-19 virus is diminishing, and more businesses can operate more freely providing scope for satisfying demand.
Gross domestic product (GDP) grew by 1.6% during the first quarter of 2021. GDP growth worked out to 6.4% annualized.
Some analysts believe growth in GDP would have been even higher if supplies had not been so difficult to find. Shortages of parts like semiconductors and automobile axles (to name a few) ate into demand. The net of all this translates into WTI crude oil of $77 over the next six months, according to a top financial house.
Supply/Demand Balances
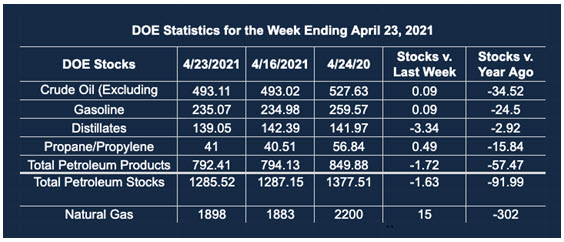
Supply/demand data in the United States for the week ended April 23, 2021, were released by the Energy Information Administration.
Total commercial stocks of petroleum fell by 1.6 million barrels during the week ended April 23, 2021.
Commercial crude oil supplies in the United States increased by 0.1 million barrels from the previous report week to 493.1 million barrels.
Crude oil inventory changes by PAD District:
PADD 1: Plus 1.6 to 9.5 million barrels
PADD 2: Plus 2.7 million barrels to 132.4 million barrels
PADD 3: Down 5.1 million barrels to 280.0 million barrels
PADD 4: Plus 0.7 million barrels to 24.8 million barrels
PADD 5: Plus 0.1 million barrels to 46.4 million barrels
Cushing, Oklahoma, inventories were up 0.7 million barrels from the previous report week to 46.1 million barrels.
Domestic crude oil production was down 0.1 million barrels per day from the previous report week to 10.9 million barrels daily.
Crude oil imports averaged 6.616 million barrels per day, a daily increase of 1,211,000 barrels. Exports decreased 7,000 barrels daily to 2.541 million barrels per day.
Refineries used 85.4% of capacity, 0.4 percentage points higher from the previous report week.
Crude oil inputs to refineries increased 253,000 barrels daily; there were 15.015 million barrels per day of crude oil run to facilities. Gross inputs, which include blending stocks, rose 63,000 barrels daily to 15.487 million barrels daily.
Total petroleum product inventories rose 3.0 million barrels from the previous report week.
Gasoline stocks rose 0.1 million barrels from the previous report week; total stocks are 235 million barrels.
Demand for gasoline fell 227,000 barrels per day to 8.877 million barrels per day.
Total product demand increased 1.633 million barrels daily to 20.395 million barrels per day.
Distillate fuel oil stocks fell 3.3 million barrels from the previous report week; distillate stocks are at 139.0 million barrels. EIA reported national distillate demand at 4.330 million barrels per day during the report week, an increase of 475,000 barrels daily.
Propane stocks rose 0.1 million barrels from the previous report week to 41.0 million barrels. The report estimated current demand at 1.149 million barrels per day, an increase of 471,000 barrels daily from the previous report week.
Natural Gas
Natural gas spot futures have been moving higher. Prices bottomed at 2.453 early in April. Since then, prices reached $2.97, just short of round-number resistance at $3.00. This market has not matched the volatility of liquids prices because natural gas supply has not been as inhibited as crude oil. January 2021 production was put at 113 Bcf, nearly the same as the year before. Crude oil production lags well behind its recent high of 13 million barrels daily.
A break of $3.00 resistance could lead to $3.04 and then $3.07. The most recent high for natural gas futures is $3.316, last seen in February 2021.
According to the EIA:
The net [natural gas] injections into storage totaled 15 Bcf for the week ending April 23, compared with the five-year (2016–2020) average net injections of 67 Bcf and last year’s net injections of 66 Bcf during the same week. Working natural gas stocks totaled 1,898 Bcf, which is 40 Bcf lower than the five-year average and 302 Bcf lower than last year at this time.
Was this helpful? We’d like your feedback.
Please respond to [email protected]
Powerhouse Futures & Trading Disclaimer
Copyright 2021 Powerhouse Brokerage, LLC, All rights reserved


