Active Hurricane Season Heightens Risks
- A dramatic hurricane season in in store this year
- Gauging the importance of weather events is not possible
- Protecting prices and margins is possible
- Natural gas futures turn bearish
Sincerely
Al Levine, Chair
Powerhouse
(202) 333-5380

The Matrix
June 1st is the start the 2024 hurricane season, extending through November 30th. Weather is central to creating demand for energy. This year, the impact of summer turbulence may be more dramatic than in the past.
The hurricane season arrives this year while oil markets turned away from geopolitical matters last week. Traders focused instead on inflation, a declining likelihood of rate cuts by the Federal Reserve, and the bearish impact on demand of elevated interest costs. Changes in the focus of traders are common. And recent events in Israel, Saudi Arabia, Iran, and OPEC+ emphasize this point. These issues will not disappear, but other forces will, at least for now, come to the foreground.
Meteorologists expect a very active hurricane season this year. Several weather groups are predicting between 20 and 25 named storms, with one outlier at 30 such events. While impressive, the economic impact of these weather evets depends on intensity, and location.
Most hurricanes that affect the U.S. strike the Southeast and the U.S. Gulf Coast, with implications for production of crude oil offshore and refining in Texas and Louisiana. Mid-Atlantic facilities are not usually affected by events, but Hurricane Sandy impacted Bayway severely in 2012. Even lesser storms can impact operations in New York harbor potentially limiting petroleum product supply.
There is no way to predict where or when a hurricane may present itself. And no way to know its intensity. Last year was an example. In 2023, there were 20 named storms; only one made landfall in the United States. Lethargy might be the result of recent domestic weather inactivity.
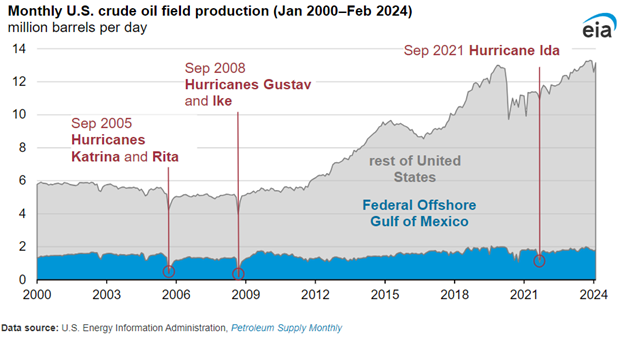
Hurricanes Katrina and Rita inflicted major damage on Gulf Coast refining in September 2005. They were a wakeup call too. Refineries were hardened. Some were even shut permanently. Inadequacies in many parts of the delivery system were identified and improved.
Uncertainty in the face of the unknown could become expensive. Operations on the Gulf Coast are much better than before Hurricane Katrina. They are not invulnerable. There are solutions to the lack of knowledge frustrating price managers. Powerhouse can help lay out possibilities that can help you weather the storms of hurricane season, 2024.
Supply/Demand Balances
Supply/demand data in the United States for the week ended May 17, 2024, were released by the Energy Information Administration.
Total commercial stocks of petroleum increased (⬆) 7.5 million barrels to 1.25 billion barrels during the week ended May 17, 2024.
Commercial crude oil supplies in the United States were lower (⬇) by 2.5 million barrels from the previous report week to 457 million barrels.
Crude oil inventory changes by PAD District:
PADD 1: Up (⬆) 0.4 million barrels to 8.4 million barrels
PADD 2: Down (⬇) 2.3 million barrels to 120.4 million barrels
PADD 3: Up (⬆) 3.6 million barrels to 261.5 million barrels
PADD 4: Up (⬆) 0.2 million barrels to 24.9 million barrels
PADD 5: Down (⬇) 0.1 million barrels to 43.7 million barrels
Cushing, Oklahoma, inventories were 1.3 million barrels Up (⬆) at 36.3 million barrels.
Domestic crude oil production was unchanged (=) at 13.1 million barrels daily.
Crude oil imports averaged 6.663 million barrels per day, a daily decrease (⬇) of 81,000 barrels. Exports increased (⬆) 595,000 barrels daily to 4.73 million barrels per day.
Refineries used 91.7% of capacity; 1.3 percentage points higher (⬆) than the previous report week.
Crude oil inputs to refineries increased (⬆) 227,000 barrels daily; there were 16.482 million barrels per day of crude oil run to facilities. Gross inputs, which include blending stocks, increased (⬆) 241,000 barrels daily to 16.894 million barrels daily.
Total petroleum product inventories increased (⬆) by 6 million barrels from the previous report week, up to 786 million barrels.
Total product demand decreased (⬇) 26,000 barrels daily to 20.03 million barrels per day.
Gasoline stocks decreased (⬇) 0.9 million barrels from the previous report week; total stocks are 226.8 million barrels.
Demand for gasoline increased (⬆) 440,000 barrels per day to 9.315 million barrels per day.
Distillate fuel oil stocks increased (⬆) 379,000 barrels from the previous report week; distillate stocks are at 116.7 million barrels. EIA reported national distillate demand at 3.883 million barrels per day during the report week, an increase (⬆) of 52,000 barrels daily.
Propane stocks rose (⬆) 2.2 million barrels from the previous report to 64.2 million barrels. The report estimated current demand at 806,000 barrels per day, a increase (⬆) of 258,000 barrels daily from the previous report week.
Natural Gas
July natural gas futures prices spiked to $3.161 last Thursday. The EIA report of natural gas in underground storage was bullish. Injections were 78 Bcf for the week ended May 17, 2024. This was well below expectations of 84 Bcf. Working stocks were 29% higher than the five -year average and 17% more than last year at this time.
A strong reversal on Friday ended the trading week at $2.773 per million BTUs. The loss of nearly 39 cents fell below nearby support, putting the continuation of the rally at question.
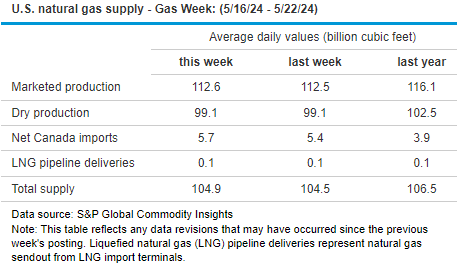
The price reversal came while supply data offered a mixed picture underlying the market. Production of dry natural gas was 99.1 Bcf/d during the week ended May 22. This remains below last year at this time, when output was 102.5 Bcf/d. LNG provided a more bearish feature. Exports were down around 12.6 Bcf.
Further weakness could bring spot futures (basis nearby continuation prices) to major support near $2.55/mmbtu.
NOAA’s Climate Prediction Center’s aggressive expectation for this year’s hurricane season offers a contrasting story regarding the natural gas market. In 2005, hurricanes Katrina and Rita interrupted offshore natural gas production which then provided 17% of U.S. marketed production. Last year, the region provided less than 2% of marketed natural gas. This suggests that a greater impact of a severe storm may come in the form of lost demand for power generation (extended widespread electricity outages).
According to the EIA:
Net injections into storage totaled 78 Bcf for the week ended May 17, compared with the five-year (2019–2023) average net injections of 92 Bcf and last year’s net injections of 97 Bcf during the same week. Working natural gas stocks totaled 2,711 Bcf, which is 606 Bcf (29%) more than the five-year average and 402 Bcf (17%) more than last year at this time.
According to The Desk survey of natural gas analysts, estimates of the weekly net change to working natural gas stocks ranged from net injections of 77 Bcf to 94 Bcf, with a median estimate of 84 Bcf.
Was this helpful? We’d like your feedback.
Please respond to [email protected]
This material has been prepared by a sales or trading employee or agent of Powerhouse Brokers, LLC and is, or is in the nature of, a solicitation. This material is not a research report prepared by Powerhouse Brokers, LLC. By accepting this communication, you agree that you are an experienced user of the futures markets, capable of making independent trading decisions, and agree that you are not, and will not, rely solely on this communication in making trading decisions.
DISTRIBUTION IN SOME JURISDICTIONS MAY BE PROHIBITED OR RESTRICTED BY LAW. PERSONS IN POSSESSION OF THIS COMMUNICATION INDIRECTLY SHOULD INFORM THEMSELVES ABOUT AND OBSERVE ANY SUCH PROHIBITION OR RESTRICTIONS. TO THE EXTENT THAT YOU HAVE RECEIVED THIS COMMUNICATION INDIRECTLY AND SOLICITATIONS ARE PROHIBITED IN YOUR JURISDICTION WITHOUT REGISTRATION, THE MARKET COMMENTARY IN THIS COMMUNICATION SHOULD NOT BE CONSIDERED A SOLICITATION.
The risk of loss in trading futures and/or options is substantial and each investor and/or trader must consider whether this is a suitable investment. Past performance, whether actual or indicated by simulated historical tests of strategies, is not indicative of future results. Trading advice is based on information taken from trades and statistical services and other sources that Powerhouse Brokers, LLC believes are reliable. We do not guarantee that such information is accurate or complete and it should not be relied upon as such. Trading advice reflects our good faith judgment at a specific time and is subject to change without notice. There is no guarantee that the advice we give will result in profitable trades.
Copyright 2024 Powerhouse Brokers, LLC, All rights reserved