RBOB Takes the Lead
- Gasoline futures make new highs
- Little improvement in U.S. product inventories
- ULSD spot futures struggle to hold on
- Natural gas outlook remains bullish
Sincerely,
Alan Levine, Chairman
Powerhouse
(202) 333-5380
The Matrix
Inventory shortfalls in the United States have elevated prices throughout the year. This has led to unseasonably high prices for refined products and is particularly showing up in RBOB spot futures. Gasoline prices have now moved over ULSD values reportedly for the first time since September 2021. RBOB futures traded over $4 for the first time ever.
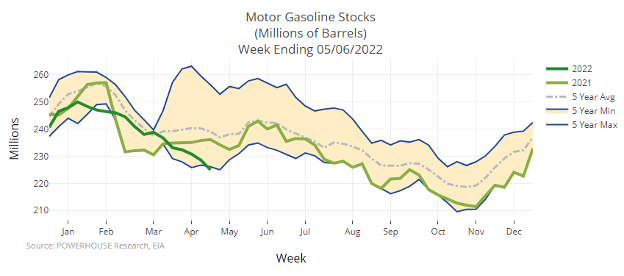
Motor Gasoline Stocks – 5-year Trend 2017 – Apr 2022 Source: EIA, POWERHOUSE
Anxiety over gasoline availability can be seen in the chart of inventories shown above. Supply has pierced the 5-year minimum.
The annual spring change in gasoline specifications, requiring a more intense level of refining, accounts for some of the boost in gasoline prices, but the sheer tightness of supply counts too. The summer driving season starts around Memorial Day heightening demand.
The release of crude oil from the U.S. Strategic Petroleum Reserve (SPR) could help the situation but demands for supply from Europe are a new factor to consider in domestic supply/demand balances. Exports of all refined products ran at 5.9 million barrels daily during the report week, about the same as last year at this time and half again as high as in May 2020.
The government reduced the SPR by seven million barrels during the week ended May 6. Expansion of refinery use to 90% of capacity led to a small, 1.4-million-barrel increase in product supply, and principal products like gasoline experienced a loss of 3.6 million barrels. Distillate fuel oil stocks declined by nearly one million barrels for the week. Supply is notably short on the East Coast (PADD 1) where only 21.3 million barrels are in stock. There were 39.8 million barrels available at this time two years ago.
China plans to reopen Shanghai in June, creating a need for more fuel. It is not at all clear what introducing transportation fuel demand from 26 million people might do to global balances and price.
Supply/Demand Balances
Supply/demand data in the United States for the week ended May 6, 2022, were released by the Energy Information Administration.
Total commercial stocks of petroleum rose 9.9 million barrels during the week ended May 6, 2022.
Commercial crude oil supplies in the United States increased by 8.5 million barrels from the previous report week to 424.2 million barrels.
Crude oil inventory changes by PAD District:
PADD 1: Plus 1.1 million barrels to 9.3 million barrels
PADD 2: Plus 1.4 million barrels to 106.9 million barrels
PADD 3: Plus 2.1 million barrels to 233.9 million barrels
PADD 4: Plus 0.5 million barrels 23.6 million barrels
PADD 5: Plus 3.4 million barrels to 50.5 million barrels
Cushing, Oklahoma, inventories were down 0.6 million barrels from the previous report week to 28.2 million barrels.
Domestic crude oil production was down 100,000 barrels per day from the previous report week to 11.8 million barrels daily.
Crude oil imports averaged 6.390 million barrels per day, a daily decrease of 62,000 million barrels. Exports decreased 695,000 barrels daily to 2.879 million barrels per day
Refineries used 90% of capacity; 1.6 percentage points higher from the previous report week.
Crude oil inputs to refineries increased 230,000 barrels daily; there were 15.696 million barrels per day of crude oil run to facilities. Gross inputs, which include blending stocks, rose 280,000 barrels daily to 16.147 million barrels daily.
Total petroleum product inventories were plus 1.4 million barrels from the previous report week, rising to 732.1 million barrels.
Total product demand decreased 235,000 thousand barrels daily to 19.231 million barrels per day.
Gasoline stocks decreased 3.6 million barrels from the previous report week; total stocks are 225.0 million barrels.
Demand for gasoline fell 154,000 barrels per day to 8.702 million barrels per day.
Distillate fuel oil stocks decreased 0.9 million barrels from the previous report week; distillate stocks are at 104.0 million barrels. EIA reported national distillate demand at 3.777 million barrels per day during the report week, a decrease of 179,000 barrels daily.
Propane stocks increased 3.4 million barrels from the previous report week; propane stocks are at 44.2 million barrels. The report estimated current demand at 0.777 million barrels per day, a decrease of 204,000 barrels daily from the previous report week.
Natural Gas
Natural gas prices should be heading downward as winter fades. This has not happened as the same forces that are influencing oil supply are being felt in natural gas. Thus far in May, prices have ranged $1.72, topping most recently at $8.15. This is a 27% increase in value.
One analyst says the seasonal decline in price (late May to early September) over the past ten years is a 28% loss in spot futures. It is possible the market has already seen whatever decline might occur. The injection season is beginning at only 1.6 Tcf this year.
According to the EIA:
Net injections [of natural gas] into storage totaled 76 Bcf for the week ended May 6, compared with the five-year (2017–2021) average net injections of 82 Bcf and last year’s net injections of 70 Bcf during the same week. Working natural gas stocks totaled 1,643 Bcf, which is 312 Bcf lower than the five-year average and 376 Bcf lower than last year at this time.
Was this helpful? We’d like your feedback.
Please respond to [email protected]
Powerhouse Futures & Trading Disclaimer
Copyright 2021 Powerhouse Brokerage, LLC, All rights reserved