Spot Gasoline Futures May Have Reached Seasonal Peak
- Gasoline price lose 16% in four weeks
- Prices typically peak at this time
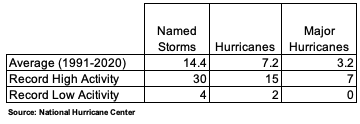
- Average year has 7.2 hurricanes
- Natural gas prices are rangebound
Sincerely,
Alan Levine, Chairman
Powerhouse
(202) 333-5380
The Matrix
Product prices were flat last week. Gasoline settled at $2.4302 for the week ended May 12 (+$0.0550,) but had lost considerable ground in the preceding month. Prices fell more than 46 cents since April 14, when prices topped $2.8943. This was a 16% loss of value.
There may be many reasons for gasoline prices to have fallen. The simplest explanation may be the normal seasonal selloff that begins in May and extends through autumn.
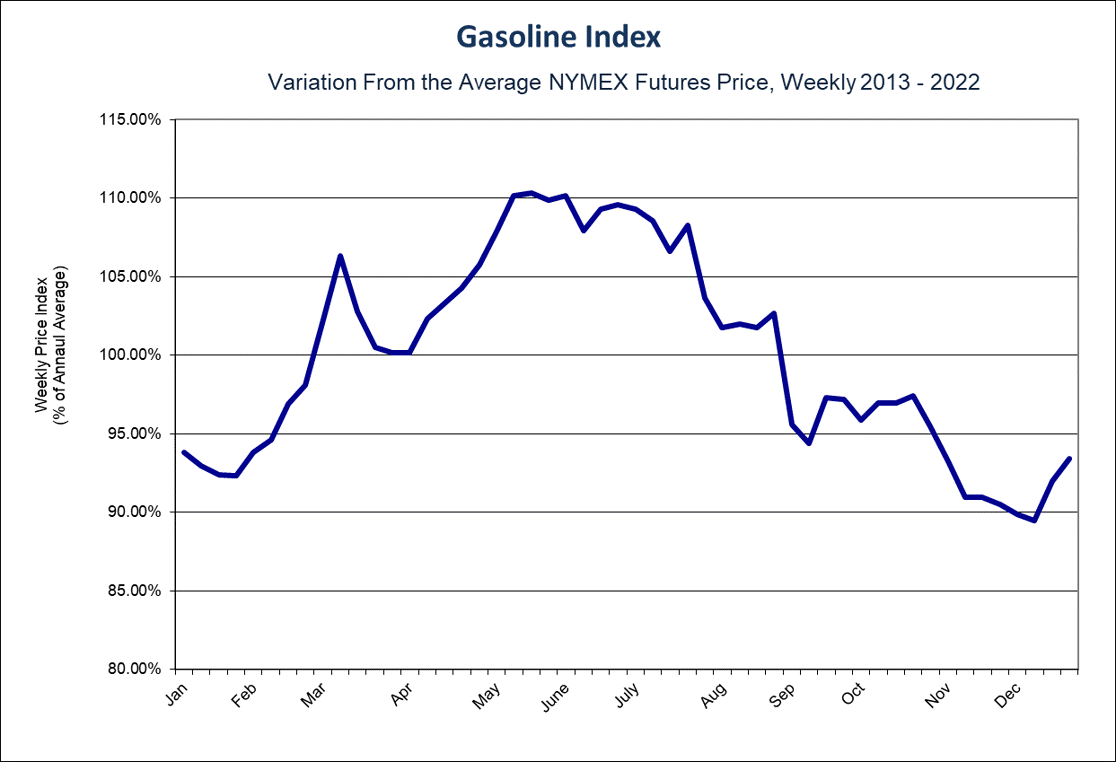
The pattern is shown in the chart above. These are relative variations in weekly RBOB futures prices versus their average from 2013 through 2022. The May top has been clearly established.
Much can happen to change the course of events for gasoline. In the near term, weather events are paramount. Hurricanes can wreak havoc with demand and supply. Last year’s hurricane season was the third-costliest tropical cyclone season on record. There were 14 storms recorded, of which eight were hurricanes and two were Major Hurricanes, listed as Category 3+.
The strongest storm was named Fiona. It reached maximum winds of 140 mph. It was felt largely in Maritime Canada.
Since H. Katrina, August, 2005, refiners have done much to harden facilities along the Gulf Coast, potentially reducing the impact new hurricanes. (Rigs in the Gulf could still need to be abandoned.) But impacts on demand in the Southeast and on supply terminals and pipelines remain a threat.
The Atlantic hurricane season begins officially on June 1, and ends on November 30 each year. Hurricanes can occur at any time, however, and an unnamed subtropical storm was recorded in January of this year. Nonetheless, over 97% of hurricanes occur during the official season.
Many predictions of hurricane activity are issued around this time. For references, statistics of tropical activity may be of interest:
Supply/Demand Balances
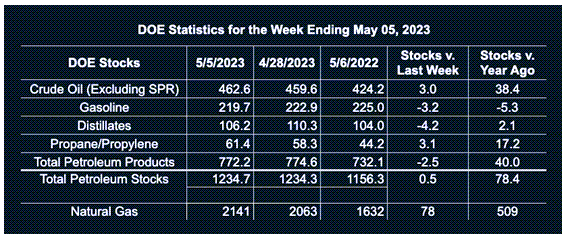
Supply/demand data in the United States for the week ended May 5, 2023, were released by the Energy Information Administration.
Total commercial stocks of petroleum rose (⬆) 0.5 million barrels to 1.2347 billion barrels during the week ended May 5, 2023.
Commercial crude oil supplies in the United States were higher (⬆) by 3 million barrels from the previous report week to 462.6 million barrels.
Crude oil inventory changes by PAD District:
PADD 1: Up (⬆) 1.3 million barrels at 8.8 million barrels
PADD 2: Down (⬇) 0.1 million barrels to 119.9 million barrels
PADD 3: Down (⬇) 1.1 million barrels to 253.8 million barrels
PADD 4: Up (⬆) 1.3 million barrels to 26.8 million barrels
PADD 5: Up (⬆) 1.6 million barrels to 53.3 million barrels
Cushing, Oklahoma, inventories were Up (⬆) 0.4 million barrels from the previous report week to 34.0 million barrels.
Domestic crude oil production was unchanged (=) at 12.3 million barrels daily from the previous report week.
Crude oil imports averaged 5.553 million barrels per day, a daily decrease (⬇) of 843,000 barrels. Exports decreased (⬇) 1.861 million barrels daily to 2.876 million barrels per day.
Refineries used 91.0% of capacity; 0.3 percentage points higher (⬆) than the previous report week.
Crude oil inputs to refineries increased (⬆) 10,000 barrels daily; there were 15.745 million barrels per day of crude oil run to facilities. Gross inputs, which include blending stocks, increased (⬆) 24,000 barrels daily to 16.402 million barrels daily.
Total petroleum product inventories decreased (⬇) by 2.6 million barrels from the previous report week, up to 772.1 million barrels.
Total product demand increased (⬆) 358,000 barrels daily to 20.164 million barrels per day.
Gasoline stocks decreased (⬇) 3.2 million barrels from the previous report week; total stocks are 219.7 million barrels.
Demand for gasoline increased (⬆) 685,000 barrels per day to 9.303 million barrels per day.
Distillate fuel oil stocks decreased (⬇) 4.2 million barrels from the previous report week; distillate stocks are at 106.2 million barrels. EIA reported national distillate demand at 4.035 million barrels per day during the report week, an increase (⬆) of 164,000 barrels daily.
Propane stocks increased (⬆) by 3.1 million barrels from the previous report week to 61.4 million barrels. The report estimated current demand at 454,000 barrels per day, a decrease (⬇) of 651,000 barrels daily from the previous report week.
Natural Gas
Spot futures prices for Henry Hub natural gas are trading a directionless course. Last week, their range was less than 19 cents, around an average of $2.23 MMBtus. Neither HDD or CDD generation were notable. The country produced 19 more HDDs than normal for the week ended May 4. Only 8 CDDs were created, four fewer than normal.
Changes in supply balances were minimal too. Natural gas supply dropped 1.2% for the week ended May 10. Both production of dry gas and imports from Canada fell. Demand dropped by 5.1 Bcf/d, a whopping 7.3%, reflecting the diminution of degree days during the period.
Seasonal slowdowns were seen in deliveries to LNG export facilities. For the third consecutive week deliveries fell. The report week declined by 4.2% to 12.9 Bcf/d.
The technical picture appears to be uninteresting as well. Prices have been rangebound since March. The RSI measures 51.4, with no divergence.
Caution remains in order. Markets in the U.S. may be calm just now, but an active global economy contains the seeds of change. And with natural gas now established as a global commodity, changes in flows, political considerations and shifting economic alliances cannot be ignored by natural gas interests. China is re-engaging after its self-imposed Covid isolation, and Russia has found new markets in Asia.
It is Mid-May. The next seasonal move is a summer rally. It is, of course, not guaranteed. Uncertainty abounds around the direction of interest rates, consumer demand and inventory balances, all of which could influence price.
According to the EIA:
Net [natural gas] injections into storage totaled 78 Bcf for the week ended May 5, compared with the five-year (2018–2022) average net injections of 87 Bcf and last year’s net injections of 76 Bcf during the same week. Working natural gas stocks totaled 2,141 Bcf, which is 332 Bcf (18%) more than the five-year average .and 509 Bcf (31%) more than last year at this time.
Was this helpful? We’d like your feedback.
Please respond to [email protected]
Powerhouse Futures & Trading Disclaimer
Copyright 2023 Powerhouse Brokerage, LLC, All rights reserved