Oil Price Pressure Responds to OPEC, Virus Worries
- ULSD, RBOB and WTI futures break support
- OPEC+ effectively comes apart
- Only now are long hedgers coming into the market
- Natural gas holds support

The Matrix
The global order of crude oil supply was torn apart on the weekend of Saturday/Sunday, March 7 and 8. Russia, the “plus” in OPEC+, would not accede to further cuts in production. Negotiations were underway to renew the OPEC+ agreement.
Russia’s reluctance to participate further drew a strong response from Saudi Arabia. The Kingdom announced plans to raise crude oil output to “well above” ten million barrels per day. The Saudis slashed prices, offering prices at discounts not seen in many years.
When futures trading resumed, WTI crude fell to $27.34 before stabilizing. Support lay at $26.05, seen last in February, 2016. ULSD reached $1.08 as its low. Support here stands at $0.8487. RBOB fell to $1.0574.
The actions of the Saudis were heightened by presence of Covid-19. Responses to the virus were being ratcheted higher. Proposals and actions to impose isolation on large swathes of the population brought with them potentials for loss of demand, especially among transport fuels.
OPEC+s inability to agree on an expansion of production cuts in support of price and market share caused market unrest to explode.
The fight for market share which is developing should result in further price weakness and perhaps added loss of share to U.S. shale producers. Broader implications of the Saudi-Russian split could spell added challenges to what seemed to be a blossoming far-ranging relationship between Saudi Arabia and Russia.
Traditionally, Saudi Arabia led the way in limiting supply, accepting loss of revenue as production fell. Producers in the United States did not/could not reduce production, spoiling Saudi’s role of global balance wheel. If Russia does not share in supply cuts, Saudi Arabia is even more weakened as leader of OPEC.
Lower prices should, one might expect, encourage buyers to stockpile now lower-priced supplies. One measure of this activity could be found in data on Open Interest. Open Interest is a measure of the number of futures contracts available to the market.
ULSD, the fuel of truck transportation and manufacturing, had 471,000 open futures contracts in late October, 2019. Open Interest fell through the fourth quarter of 2019. The Open Interest of ULSD as January ended was about 404,000 contracts. In March, the number of futures positions has moved lower, reaching 402.8 thousand contracts during the week of March 13, 2020.
Supply/Demand Balances
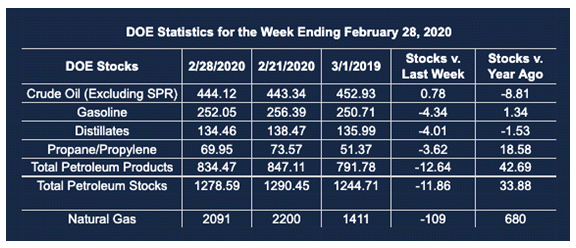
Supply/demand data in the United States for the week ending Feb. 28, 2020, were released by the Energy Information Administration.
Total commercial stocks of petroleum fell by 11.9 million barrels during the week ending Feb. 28, 2020.
Commercial crude oil supplies in the United States increased by 0.8 million barrels from the previous report week to 444.3 million barrels.
Crude oil inventory changes by PAD District:
PADD 1: Down 0.2 million barrels to 10.3 million barrels
PADD 2: Down 2.5 million barrels to 124.3 million barrels
PADD 3: Plus 3.5 million barrels to 236.1 million barrels
PADD 4: Plus 0.1 million barrels to 20.5 million barrels
PADD 5: Down 0.1 million barrels to 53.0 million barrels
Cushing, Oklahoma inventories down 1.9 million barrels from the previous report week to 37.2 million barrels.
Domestic crude oil production rose 100,000 barrels per day from the previous report week to 13.1 million barrels daily.
Crude oil imports averaged 6.238 million barrels per day, a daily increase of 21,000 barrels. Exports rose 497,000 barrels daily to 4.154 million barrels per day.
Refineries used 86.9 percent of capacity, down 1.0% from the previous report week.
Crude oil inputs to refineries decreased 312,000 barrels daily; there were 15.696 million barrels per day of crude oil run to facilities. Gross inputs, which include blending stocks, fell 176,000 barrels daily to reach 16.348 million barrels daily.
Total petroleum product inventories fell 12.7 million barrels from the previous report week.
Gasoline stocks decreased 4.3 million barrels daily from the previous report week; total stocks are 252.0 million barrels.
Demand for gasoline rose 150,000 barrels per day to 9.186 million barrels per day.
Total product demand increased 1.388 million barrels daily to 21.272 million barrels per day.
Distillate fuel oil stocks decreased 4.0 million barrels from the previous report week; distillate stocks are at 134.5 million barrels. EIA reported national distillate demand at 3.919 million barrels per day during the report week, an decrease of 201,000 barrels daily.
Propane stocks decreased 3.6 million barrels from the previous report week; propane stocks are 70.0 million barrels. The report estimated current demand at 1.791 million barrels per day, a decrease of 569,000 barrels daily from the previous report week.
Natural Gas
Natural gas prices clung to support just over $1. 70. The concerns over Covid-19 have not pressured natural gas prices lower. Much the damage to the bull case had shown up earlier in response to warmer weather and abundant production.
According to EIA:
The net withdrawal [of natural gas] from storage totaled 109 Bcf for the week ending February 28, compared with the five-year (2015–19) average net withdrawal of 106 Bcf and last year’s net withdrawal of 152 Bcf during the same week. Working natural gas stocks totaled 2,091 Bcf, which is 176 Bcf more than the five-year average and 680 Bcf more than last year at this time.
The average rate of withdrawal from storage is 8% lower than the five-year average so far in the withdrawal season (November through March). If the rate of withdrawal from storage matched the five-year average of 6.8 Bcf/d for the remainder of the withdrawal season, the total inventory would be 1,873 Bcf on March 31, which is 176 Bcf higher than the five-year average of 1,697 Bcf for that time of year.
Futures trading involves significant risk and is not suitable for everyone. Transactions in securities futures, commodity and index futures and options on future markets carry a high degree of risk. The amount of initial margin is small relative to the value of the futures contract, meaning that transactions are heavily “leveraged”. A relatively small market movement will have a proportionately larger impact on the funds you have deposited or will have to deposit: this may work against you as well as for you. You may sustain a total loss of initial margin funds and any additional funds deposited with the clearing firm to maintain your position. If the market moves against your position or margin levels are increased, you may be called upon to pay substantial additional funds on short notice to maintain your position. If you fail to comply with a request for additional funds within the time prescribed, your position may be liquidated at a loss and you will be liable for any resulting deficit. Past performance may not be indicative of future results. This is not an offer to invest in any investment program.
Powerhouse is a registered affiliate of Coquest, Inc.
Was this helpful? We’d like your feedback.
Please respond to [email protected]
Copyright© 2020 Powerhouse, All rights reserved.