

Oil Futures Rise; Southwest States Experience Weather Problems
- Domestic crude supplies rose 21.6 million barrels
- End of the “drill, baby, drill” era?
- OPEC+ holds supply constraints with exceptions
- LNG exports support the price of natural gas

Alan Levine—Chairman, Powerhouse
(202) 333-5380
The Matrix
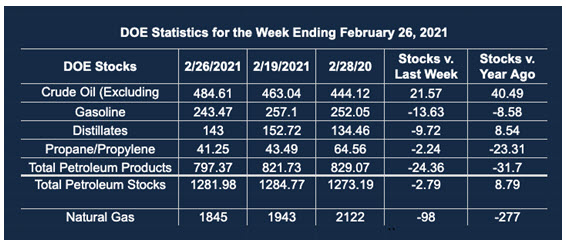
The weekly EIA supply/demand report for the week ended February 26, 2021, booked a gain of 21.6 million barrels of crude oil in storage. Additional stocks and a recovery in domestic crude oil production are both bearish for price. Nonetheless, energy spot futures are continuing to make new highs. April ULSD ended last week at $1.944. RBOB ended the week at $2.0647. WTI April crude oil futures ended the week at $66.09.
Propane stocks lost 2.2 million barrels. There are 41.2 million barrels now in storage.
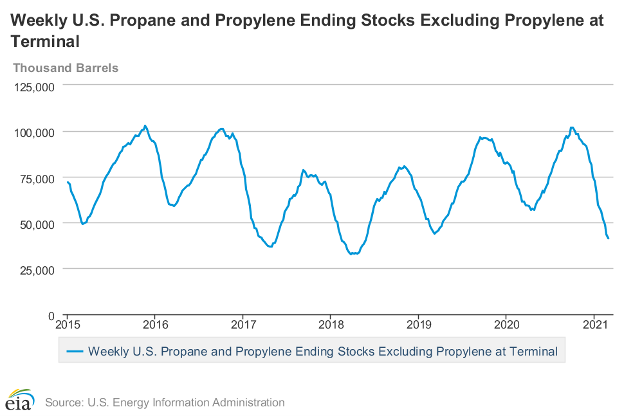
Propane Stocks 2015 – 2021 Source: EIA
EIA’s chart of propane stocks is shown above. Storage follows a definite seasonal pattern with highs in late summer and lows in March or April. Indeed, the current supply level has moved lower than the lows in 2019 and 2020 contributing to today’s high futures price. Propane’s next historical low is at 33.0 thousand, last seen in early April, 2018.
Evaluating factors that can determine price is challenging at best. The impact of Covid-19 has been broad in its scope. The availability of a viable vaccine has eased (but not eliminated) concerns of a deep recession.
Seasonal considerations continue to be shaped by unusual weather patterns. Powerhouse has noted the impact of changes in the Polar Vortex. This weather feature broke typical late winter patterns.
The most recent price spike can be traced to an agreement to continue to constrain production through April. Moreover, Saudi Arabia will continue its one-million barrel per day reduction at least through March.
OPEC+ is supporting price despite the possibilities of renewed shale output. Saudi Arabia is reportedly sure that U.S. shale oil producers will not meet higher prices with higher production. One large U.S. producer put it this way, “A couple years ago it was drill, baby, drill. Now it’s show me the money,” referring to demands of shareholders for dividends.
Russia and Kazakhstan will be allowed to increase production by 150,000 barrels per day through March. These countries assert seasonal patterns support this exception.
These events are occurring as the rollout of Covid-19 vaccines continue to support global oil demand.
Supply/Demand Balances
Supply/demand data in the United States for the week ended February 26, 2021 were released by the Energy Information Administration.
Total commercial stocks of petroleum fell by 2.8 million barrels during the week ended February 26, 2021.
Commercial crude oil supplies in the United States increased by 21.6 million barrels from the previous report week to 484.6 million barrels.
Crude oil inventory changes by PAD District:
PADD 1: Plus 0.5 million barrels to 8.9 million barrels
PADD 2: Plus 1.1 million barrels to 135.1 million barrels
PADD 3: Plus 20.8 million barrels to 267.7 million barrels
PADD 4: Down 0.1 million barrels to 22.9 million barrels
PADD 5: Down 0.7 million barrels to 50.0 million barrels
Cushing, Oklahoma inventories were up 0.5 million barrels from the previous report week to 48.3 million barrels.
Domestic crude oil production was up 300,000 barrels per day from the previous report week to 10.0 million barrels daily.
Crude oil imports averaged 6.292 million barrels per day, a daily increase of 1,692,000 barrels. Exports increased 37,000 barrels daily to 3.351 million barrels per day.
Refineries used 56.0% of capacity, down 12.6% from the previous report week.
Crude oil inputs to refineries decreased 2,327,000 barrels daily; there were 9.903 million barrels per day of crude oil run to facilities. Gross inputs, which include blending stocks, fell 2,315,000 barrels daily to 10.300 million barrels daily.
Total petroleum product inventories fell 24.4 million barrels from the previous report week.
Gasoline stocks fell 13.6 from the previous report week; total stocks are 243.5 million barrels.
Demand for gasoline rose 942,000 barrels per day to 8.148 million barrels per day.
Total product demand increased 72,000 barrels daily to 18.759 million barrels per day.
Distillate fuel oil stocks fell 9.7 million barrels from the previous report week; distillate stocks are at 143.0 million barrels. EIA reported national distillate demand at 3.788 million barrels per day during the report week, a decrease of 145,000 barrels daily.
Propane stocks decreased 2.2 million barrels from the previous report week; propane stocks are 41.2 million barrels. The report estimated current demand at 1.487 million barrels per day, an increase of 536,000 barrels daily from the previous report week.
Natural Gas
Exports of Liquified Natural Gas (LNG) remain the big news in natural gas. The DOE’s Natural Gas Monthly reported that LNG exports rose 6.6 Bcf/d in 2020. Hurricanes Laura and Delta inhibited growth in November and December. Still, LNG exports made new highs. This reflected higher Asian spot prices because of extremely cold weather in Asia. Facility shutdowns in several countries reduced global supply. At the same time, U.S. export capability increased as new facilities came on board.
According to the EIA:
The net [natural gas] withdrawals from storage totaled 98 Bcf for the week ending February 26, compared with the five-year (2016–2021) average net withdrawals of 81 Bcf and last year’s net withdrawals of 119 Bcf during the same week. Working natural gas stocks totaled 1,845 Bcf, which is 178 Bcf lower than the five-year average and 277 Bcf lower than last year at this time.
The average rate of withdrawals from storage is 22% higher than the five-year average so far in the withdrawal season (November through March). If the rate of withdrawals from storage matched the five-year average of 6.6 Bcf/d for the remainder of the withdrawal season, the total inventory would be 1,628 Bcf on March 31, which is 178 Bcf lower than the five-year average of 1,806 Bcf for that time of year.
Was this helpful? We’d like your feedback.
Please respond to [email protected]
Powerhouse Futures & Trading Disclaimer
Copyright 2021 Powerhouse Brokerage, LLC, All rights reserved


