Gasoline Futures Roll to Summer Spec
- RBOB prices add $0.21
- Price gain is normal seasonal change
- RBOB crack spreads reach new highs
- More March HDD’s expected with less market impact
Sincerely,
Alan Levine, Chairman
Powerhouse
(202) 333-5380
The Matrix
March RBOB futures expired on Tuesday at $2.43 per gallon. April RBOB futures became the front-month the next day at $2.64.
The 8.5% gain reflected a seasonal change in NYMEX’s specification for physical RBOB. Reid Vapor Pressure (RVP) is a measure of gasoline evaporation. The Environmental Protection Administration (EPA) requires a lower RVP for retail gasoline from June 1 to September 15. This requires additional refining work, reflected in higher RBOB costs.
The gap in futures prices from this shift in specification is a regular feature of technical price charts. Technical traders know this and treat the gap accordingly. This year, the gap measured $0.2077 per gallon.
Gasoline traded on the NYMEX has had its share of specification alterations. NYMEX’s parent, the Chicago Mercantile Exchange (CME) provides some history:
The NYMEX changed the grade of gasoline that is to be traded at their exchange in 2006. In the late twentieth century it went from leaded to unleaded. The New York Mercantile Exchange (NYMEX) began a contract for unleaded gasoline (first UR, then HU) in late 1984. Beginning in October 2005, NYMEX began trading a futures contract for delivery of RBOB gasoline alongside HU futures, as unleaded futures products were phased out of the commodities futures selection.
Gasoline accounts for nearly half of the refinery barrel.
The chart above shows recent experience with margins for refiners of gasoline. Wide ranges and winter season lows notwithstanding, refinery margins from RBOB have been trending higher during the COVID years. The June, 2023 RBOB crack spread contract high at nearly $34 reflects the recovery of demand for gasoline in recent years. At the same time, crude oil prices have traded generally flat as production has struggled to keep pace.
Supply/Demand Balances
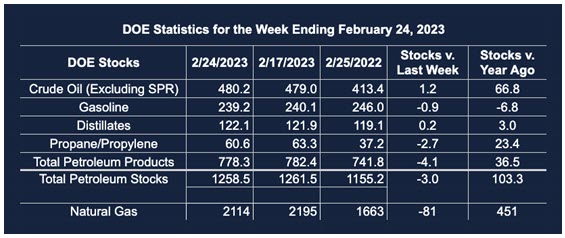
Supply/demand data in the United States for the week ended February 24, 2023, were released by the Energy Information Administration.
Total commercial stocks of petroleum fell (⬇) 3.0 million barrels to 1.259 billion barrels during the week ended February 24, 2023.
Commercial crude oil supplies in the United States were higher (⬆) by 1.2 million barrels from the previous report week to 480.2 million barrels.
Crude oil inventory changes by PAD District:
PADD 1: Down (⬇) 0.9 million barrels to 7.1 million barrels
PADD 2: Plus (⬆) 0.7 million barrels to 128.6 million barrels
PADD 3: Down (⬇) 0.7 million barrels to 267.2 million barrels
PADD 4: Unchanged (=) at 25.2 million barrels
PADD 5: Plus (⬆) 2.2 million barrels to 52.1 million barrels
Cushing, Oklahoma, inventories were up (⬆) 0.3 million barrels from the previous report week to 40.7 million barrels.
Domestic crude oil production was unchanged (=) from the previous report week at 12.3 million barrels daily.
Crude oil imports averaged 6.208 million barrels per day, a daily decrease (⬇) of 118,000 barrels. Exports increased (⬆) 1.032 million barrels daily to 5.629 million barrels per day.
Refineries used 85.8% of capacity; 0.1 percentage points lower (⬇) than the previous report week.
Crude oil inputs to refineries decreased (⬇) 31,000 barrels daily; there were 14.979 million barrels per day of crude oil run to facilities. Gross inputs, which include blending stocks, fell (⬇) 10,000 barrels daily to 15.450 million barrels daily.
Total petroleum product inventories fell (⬇) by 4.2 million barrels from the previous report week, falling to 778.3 million barrels.
Total product demand increased (⬆) 195,000 barrels daily to 20.413 million barrels per day.
Gasoline stocks decreased (⬇) 0.9 million barrels from the previous report week; total stocks are 239.2 million barrels.
Demand for gasoline increased (⬆) 202,000 barrels per day to 9.112 million barrels per day.
Distillate fuel oil stocks increased (⬆) 0.2 million barrels from the previous report week; distillate stocks are at 122.1 million barrels. EIA reported national distillate demand at 3.835 million barrels per day during the report week, an increase (⬆) of 64,000 barrels daily.
Propane stocks decreased (⬇) by 2.7 million barrels from the previous report week to 60.6 million barrels. The report estimated current demand at 1.343 million barrels per day, an increase (⬆) of 27,000 barrels daily from the previous report week.
Natural Gas
Withdrawals from underground storage were greater than expected by industry sources. Weather forecasts for March call for more Heat Degree Days. Prices moved to $3.02 but did not hold the gain.
There may more HDDs expected, but March cold does not have the same market impact as such weather earlier in the heating season. One weather analyst has bemoaned fickle weather maps. “[C]older long-range weather maps have ultimately ended up trending warmer in time, and that’s the primary risk ahead,” he said.
LNG facilities at Freeport, Tx, are continuing to ramp up activity. The final liquefaction train to receive approval to resume production is set to go. The operator has asked FERC to allow it return to activity.
Freeport’s export capability runs about 16-19 cargoes monthly under normal conditions. It’s activation should ease global natural gas tightness and reduce domestic supply overhang.
According to the EIA:
Net withdrawals from storage totaled 81 Bcf for the week ended February 24, compared with the five-year (2018–2022) average net withdrawals of 134 Bcf and last year’s net withdrawals of 137 Bcf during the same week. Working natural gas stocks totaled 2,114 Bcf, which is 342 Bcf (19%) more than the five-year average and 451 Bcf (27%) more than last year at this time.
The average rate of withdrawals from storage is 24% lower than the five-year average so far in the withdrawal season (November through March). If the rate of withdrawals from storage matched the five-year average of 6.9 Bcf/d for the remainder of the withdrawal season, the total inventory would be 1,874 Bcf on March 31, which is 342 Bcf higher than the five-year average of 1,532 Bcf for that time of year.
Was this helpful? We’d like your feedback.
Please respond to [email protected]
Powerhouse Futures & Trading Disclaimer
Copyright 2023 Powerhouse Brokerage, LLC, All rights reserved