Global Oil Demand To Rise in 2018
- European and Indian demand could offset Chinese slowdown
- Slowing rate of employment growth cuts into gasoline demand
- Longer-term demand likely to slow
- NGL production reaches new annual record in 2017

The Matrix
Powerhouse’s recent observation that exports of U.S. crude oil exceeded two million barrels daily reminds us that the United States is becoming an increasingly important part of global supply/demand balances.

World Liquid Fuels Consumption: Avg Daily Consumption and YoY Change 2011 – 2019 Source: EIA.
Global demand is expected to grow in 2018. This reflects acceleration of growth of economies in Europe and India. Even the United States’ mature economy is projected to grow this year. China, long a major contributor to demand growth is likely to experience a slowdown. Some analysts expect China’s economy to grow at 4.5 per cent in 2018, well down from 6.5 per cent at its recent peak. China is reducing new procurement for its strategic reserve, cutting into demand. Another bearish demand element will be increasing fuel efficiency.
Global employment is growing, but at a decelerating rate. And with it a reduction in gasoline demand gains. This should be particularly apparent in the United States where unemployment is already approaching frictional levels.
Over a longer term, a more bearish tone has taken hold. BP, for example, concedes a peak in oil demand by 2040. The development of self-driving cars and innovative use of travel sharing are important factors. The Company expects a 100-fold increase in electric vehicles over this time.
The alternative fuel is likely to be electricity according to BP. The Company expects 30 per cent of mileage to be satisfied by electric. And 15 per cent of the car fleet will be electric powered. New technology will allow for more intense use of automobiles.
Oil demand growth may come from petrochemicals. But even there, constraint on plastic items could limit demand growth.
Renewable power is expected to grow by 40 per cent until 2040. BP expects its share of total energy to reach 14 per cent.
Supply/Demand Balances
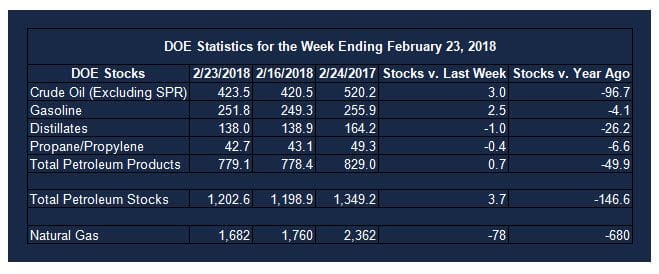
Supply/demand data in the United States for the week ending February 23, 2018 were released by the Energy Information Administration.
Total commercial stocks of petroleum rose 3.7 million barrels during the week ending February 23, 2018.
There were draws in stocks of distillates, propane, and other oils. Builds were reported in stocks of gasoline, fuel ethanol, and residual fuel. Stocks of K-jet fuel were unchanged from the previous report week.
Commercial crude oil supplies in the United States increased to 423.5 million barrels, a build of 3.0 million barrels.
Crude oil supplies increased 0.6 million barrels in PAD District 1 (East Coast), PADD 3 (Gulf Coast) crude stocks rose 4.5 million barrels, and PADD 5 (West Coast) stocks advanced 0.3 million barrels. PADD 2 (Midwest) stocks declined 2.3 million barrels and PADD 4 (Rockies) stocks fell 0.2 million barrels.
Cushing, Oklahoma inventories decreased 1.2 million barrels from the previous report week to 28.8 million barrels.
Domestic crude oil production increased 13,000 barrels daily to 10.283 million barrels per day from the previous report week.
Crude oil imports averaged 7.282 million barrels per day, a daily increase of 261,000 barrels. Exports fell 599,000 barrels daily to 1.445 million barrels per day.
Refineries used 87.8 per cent of capacity, a decrease of 0.3 percentage points from the previous report week.
Crude oil inputs to refineries increased 49,000 barrels daily; there were 15.882 million barrels per day of crude oil run to facilities. Gross inputs, which include blending stocks, fell 61,000 barrels daily to 16.251 million barrels daily.
Total petroleum product inventories saw an increase of 0.7 million barrels from the previous report week.
Gasoline stocks increased 2.5 million barrels from the previous report week; total stocks are 251.8 million barrels.
Demand for gasoline decreased 142,000 barrels per day to 8.860 million barrels daily.
Total product demand decreased 582,000 barrels daily to 19.872 million barrels per day.
Distillate fuel oil supply fell 1.0 million barrels from the previous report week to 138.0 million barrels. National distillate demand was reported at 3.921 million barrels per day during the report week. This was a weekly decrease of 303,000 barrels daily.
Propane stocks decreased 0.4 million barrels from the previous report week to 42.7 million barrels. Current demand is estimated at 1.051 million barrels per day, a decrease of 600,000 barrels daily from the previous report week.
Natural Gas
According to the Energy Information Administration:
Working gas net withdrawals are 40 Bcf lower than the five-year average. Net withdrawals from storage totaled 78 Bcf for the week ending February 23, compared with the five-year (2013–17) average net withdrawals of 118 Bcf and last year’s net withdrawals of 7 Bcf during the same week. Working gas stocks totaled 1,682 Bcf, which is 372 Bcf less than the five-year average and 680 Bcf less than last year at this time.
Working gas levels are 377 Bcf above the five-year minimum. If net withdrawals from working gas stocks match the five-year average for the remainder of the withdrawal season, working gas stocks will total 1,330 Bcf by March 31, 2018, which is 22% below the five-year average, and the second-lowest reported level at the end of heating season since 2010. Working gas stocks ended the 2013–14 heating season at 837 Bcf, which is the lowest-reported level for that time.
Natural gas plant liquids production reaches new annual record in 2017, with projected continued growth. Annual U.S. natural gas plant liquids (NGPL) production increased for the 12th straight year in 2017, reaching a record 3.74 million barrels per day (MMb/d), according to EIA’s February Petroleum Supply Monthly, released yesterday. Total 2017 U.S. NGPL production grew 6.4% over 2016 levels, and is double the 2007 annual production. EIA’s Short-Term Energy Outlook forecasts a 15% increase in NGPL production in 2018, which if realized would be second-highest annual increase after the 16% increase in 2014.
Futures trading involves significant risk and is not suitable for everyone. Transactions in securities futures, commodity and index futures and options on future markets carry a high degree of risk. The amount of initial margin is small relative to the value of the futures contract, meaning that transactions are heavily “leveraged”. A relatively small market movement will have a proportionately larger impact on the funds you have deposited or will have to deposit: this may work against you as well as for you. You may sustain a total loss of initial margin funds and any additional funds deposited with the clearing firm to maintain your position. If the market moves against your position or margin levels are increased, you may be called upon to pay substantial additional funds on short notice to maintain your position. If you fail to comply with a request for additional funds within the time prescribed, your position may be liquidated at a loss and you will be liable for any resulting deficit. Past performance may not be indicative of future results. This is not an offer to invest in any investment program.
Powerhouse is a registered affiliate of Coquest, Inc.
Was this helpful? We’d like your feedback.
Please respond to [email protected]
Copyright © 2018 Powerhouse, All rights reserved.