Petroleum Inventories Take A Hit
- Gasoline stocks fall from 5-year highs
- Futures prices rally
- Diesel demand to grow with IMO implementation
- EIA puts end-of-season natural gas storage at 1.2 Tcf

The Matrix
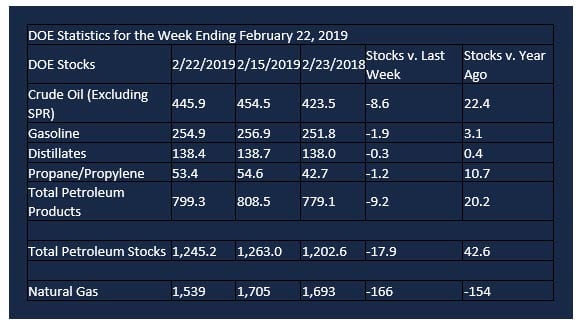
U.S. inventories of crude oil and petroleum products lost nearly 18 million barrels during the week ending February 22, 2019. Crude oil stocks accounted for 8.6 million barrels of the decline.
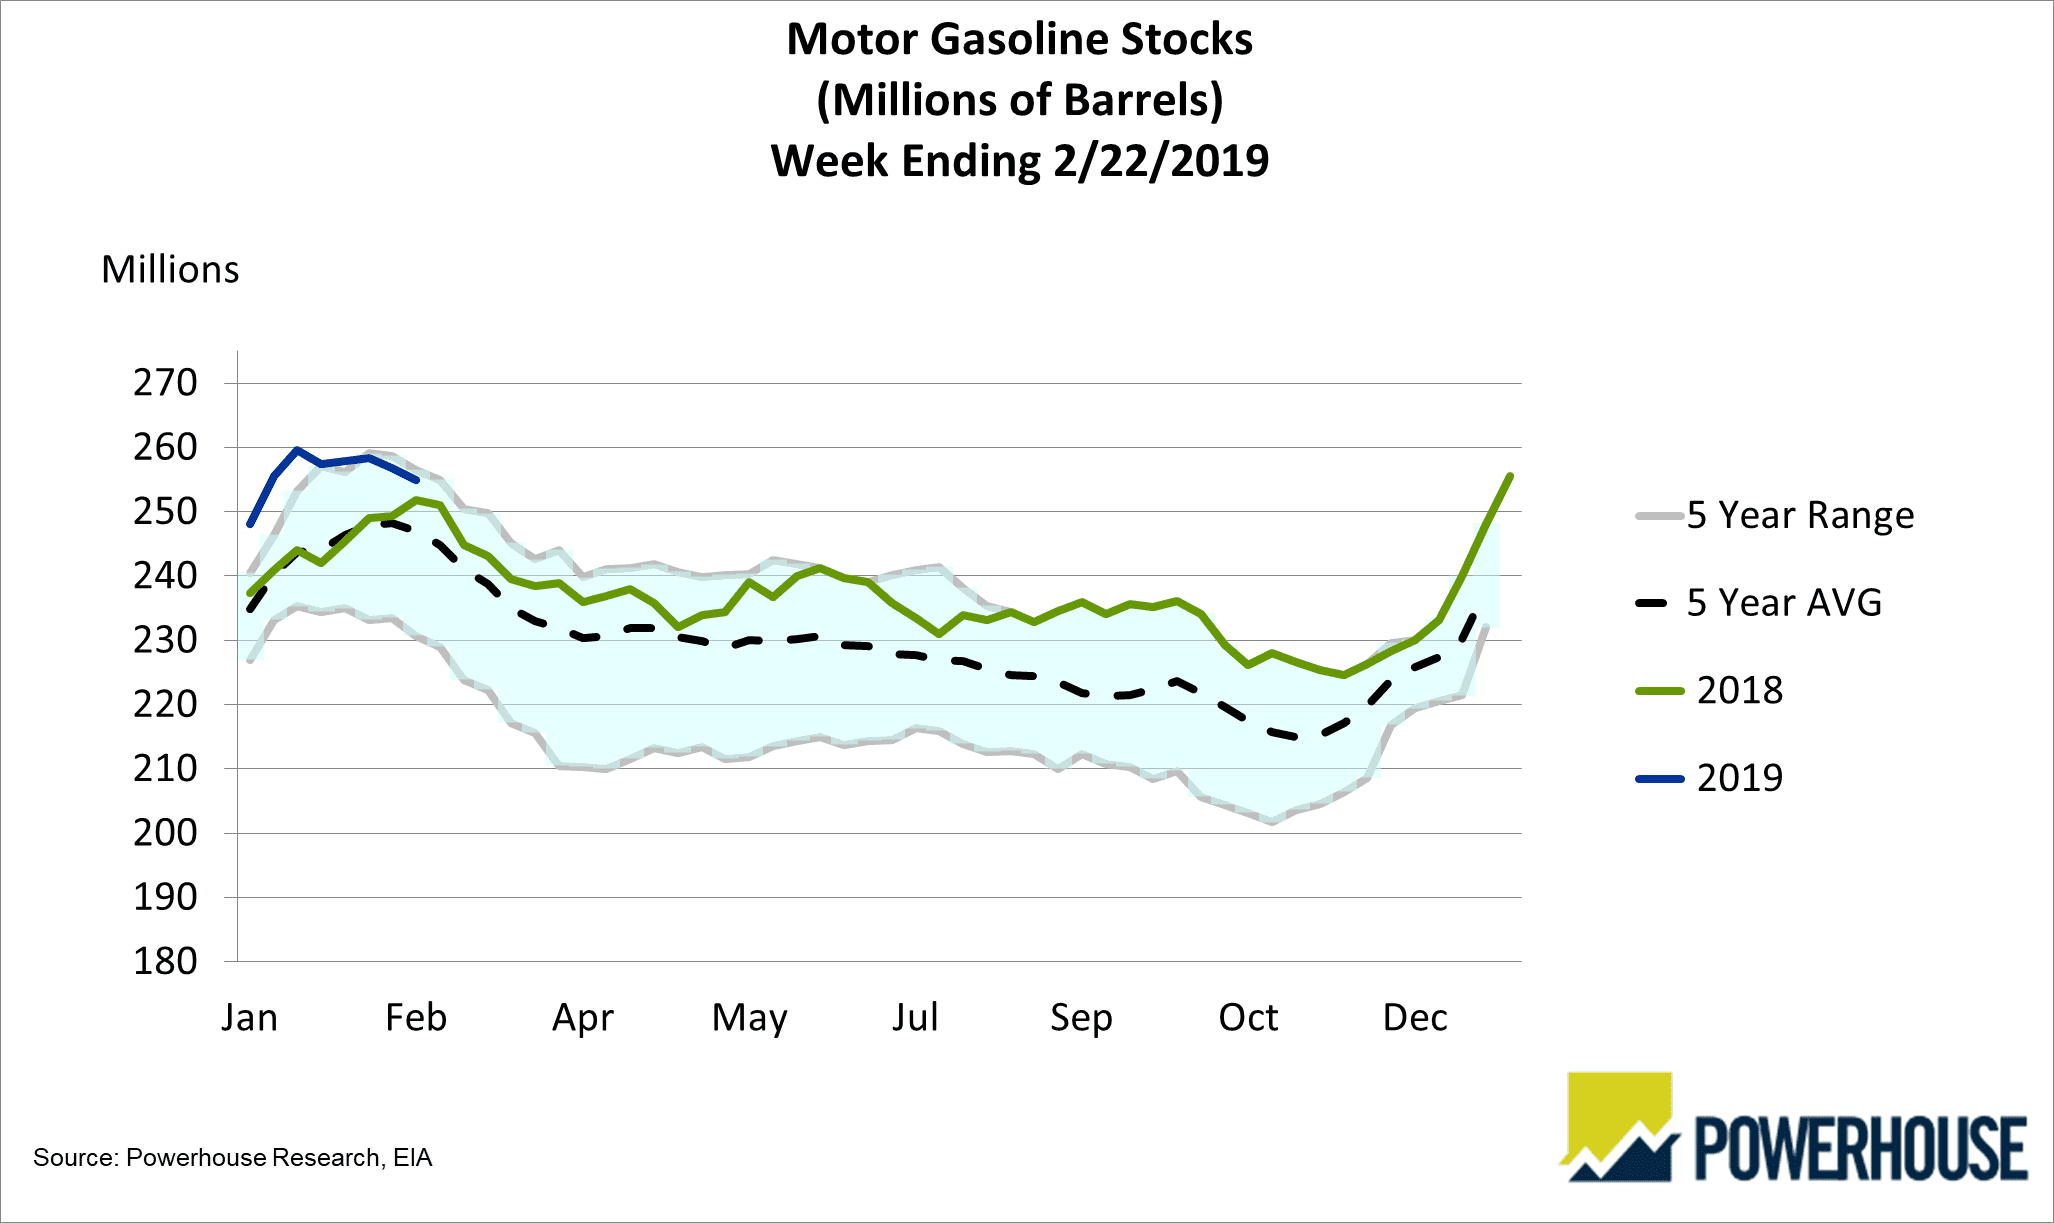
Motor Gasoline Stocks 5-Year Trend Chart: 2014-2019 Source: EIA, POWERHOUSE
Gasoline pricing may be returning to a more typical seasonal pattern. Motor gasoline stocks fell 1.9 million barrels. Supplies are starting to retreat from an early January high and have moved below the 5-year high.
Gasoline inventories have been in the upper half of the five-year range since March 2018. Notwithstanding the large supply, futures prices moved higher during this time because gasoline demand was running near and finally reaching record levels. Supplies fell only modestly.
Gasoline futures prices rose fifty-one cents from March through October 2018, when they topped at $2.34. Stocks of gasoline recovered, adding more to supply than at the previous March. Prices fell, reaching $1.44 at year-end. Inventories moved higher as Mid-Texas Permian crude oil production provided a light crude oil, attractive for gasoline refining and geographically constrained because of shortened pipeline capacity.
Prices of gasoline futures have recovered, the March contract ending its run, expiring around $1.63. (The April summer specification gasoline futures contract opens as spot gasoline, priced around $1.75.) A more typical gasoline pattern (rallies into Memorial Day) may soon be expected as crude oil distribution improves.
The situation for diesel fuels appears to be more bullish as well. Evidence suggests that foreign-flag compliance will reach over 80 per cent. This could present as bullish crack spreads during 2019.
New refinery construction has been impeded, another bullish sign. Additions to Chinese capacity have reportedly been overstated. One analyst pointed out that diesel from Chinese facilities will yield only 10 per cent.
Supply/Demand Balances
Supply/demand data in the United States for the week ending February 22, 2019 were released by the Energy Information Administration.
Total commercial stocks of petroleum decreased 17.9 million barrels during the week ending February 22, 2019.
There were draws in stocks of gasoline, fuel ethanol, K-jet fuel, distillates, residual fuel oil, propane, and other oils.
Commercial crude oil supplies in the United States decreased 8.6 million barrels from the previous report week to 445.9 million barrels.
Crude oil supplies decreased in four of the five PAD Districts. PADD 1 (East Coast) crude oil stocks fell 0.7 million barrels, PADD 2 (Midwest) crude stocks declined 0.6 million barrels, PADD 3 (Gulf Coast) stocks retreated 6.7 million barrels, and PADD 5 (West Coast) stocks decreased 0.7 million barrels from the previous report week. PAD District 4 (Rockies) registered a build of 0.2 million barrels.
Cushing, Oklahoma inventories increased 1.7 million barrels from the previous report week to 46.7 million barrels.
Domestic crude oil production rose 100,000 barrels daily previous report week to 12.1 million barrels per day.
Crude oil imports averaged 5.917 million barrels per day, a daily decrease of 1.605 million barrels per day. Exports fell 248,000 barrels daily to 3.359 million barrels per day.
Refineries used 87.1 per cent of capacity, an increase of 1.2 percentage points from the previous report week.
Crude oil inputs to refineries increased 179,000 barrels daily; there were 15.890 million barrels per day of crude oil run to facilities. Gross inputs, which include blending stocks, rose 209,000 barrels daily to 16.196 million barrels daily.
Total petroleum product inventories fell 9.3 million barrels from the previous report week.
Gasoline stocks decreased 1.9 million barrels from the previous report week; total stocks are 254.9 million barrels.
Demand for gasoline increased 181,000 barrels per day to 8.981 million barrels per day.
Total product demand increased 750,000 barrels daily to 21.470 million barrels per day.
Distillate fuel oil stocks decreased 0.3 barrels from the previous report week; distillate stocks are at 138.4 million barrels. National distillate demand was reported at 4.076 million barrels per day during the report week. This was a weekly decrease of 139,000 barrels daily.
Propane stocks decreased 1.2 million barrels from the previous report week; propane stock are 53.4 million barrels. Current demand is estimated at 1.629 million barrels per day, a decrease of 420,000 barrels daily from the previous report week.
Natural Gas
According to the Energy Information Administration:
Net withdrawals from storage totaled 166 Bcf for the week ending February 22, compared with the five-year (2014–18) average net withdrawals of 104 Bcf and last year’s net withdrawals of 85 Bcf during the same week. Working gas stocks totaled 1,539 Bcf, which is 424 Bcf lower than the five-year average and 154 Bcf lower than last year at this time.
The average rate of net withdrawals from storage is 11% lower than the five-year average so far in the withdrawal season (November through March). If the rate of withdrawals from storage matched the five-year average of 8.8 Bcf/d for the remainder of the withdrawal season, total inventories would be 1,212 Bcf on March 31, which is 424 Bcf lower than the five-year average of 1,636 Bcf for that time of year.
Weather bulls have not been rewarded for their patience. Expectations of a very cold first half of March have not been reflected in prices which have been trading around $2.83 for several days. Moreover, third-week-March forecasts could generate 50 HDDs lower than the 30-year average.
Futures trading involves significant risk and is not suitable for everyone. Transactions in securities futures, commodity and index futures and options on future markets carry a high degree of risk. The amount of initial margin is small relative to the value of the futures contract, meaning that transactions are heavily “leveraged”. A relatively small market movement will have a proportionately larger impact on the funds you have deposited or will have to deposit: this may work against you as well as for you. You may sustain a total loss of initial margin funds and any additional funds deposited with the clearing firm to maintain your position. If the market moves against your position or margin levels are increased, you may be called upon to pay substantial additional funds on short notice to maintain your position. If you fail to comply with a request for additional funds within the time prescribed, your position may be liquidated at a loss and you will be liable for any resulting deficit. Past performance may not be indicative of future results. This is not an offer to invest in any investment program.
Powerhouse is a registered affiliate of Coquest, Inc.
Was this helpful? We’d like your feedback.
Please respond to [email protected]
Copyright© 2019 Powerhouse, All rights reserved.