Tariff Day Approaches
- In an environment full of noise, pay attention to money flows
- Measurable bullish sentiment in WTI is now in force
- Divergence between crude and refined products may represent concerns over job growth
- U.S natural gas inventories refill season off to early start
Sincerely,
David Thompson, CMT
Executive Vice President
Powerhouse
(202) 333-5380
The Matrix
As the April 2 deadline for the broadscale implementation of U.S. tariffs draws near, energy markets appear to be pricing in two different aspects of this major policy shift.
Our analysis places significant emphasis on changes in futures market open interest levels. Useful analysis should be accurate, relevant, and timely. Companies face the challenge of sorting through an avalanche of information. Market opinions, even well-reasoned ones, abound. But open interest isn’t an opinion. It measures real money being put on the line.
WTI crude futures have been rallying on rising open interest. This tells us that the new money coming into the market is influenced by buyers who are motivated to cross the bid-ask spread to lift offers. An important note for those monitoring open interest themselves, it’s critical to consider total market open interest, that is open interest for all contract months for a particular commodity, not just the front month.
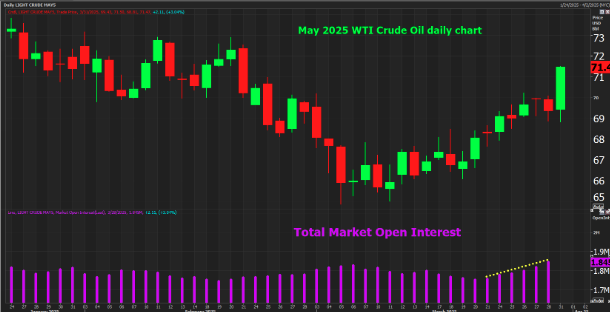
Source: LSEG
The rally in crude oil likely stems from the market’s belief that President Trump intends to follow through on implementation of his tariffs. Speaking about higher auto costs for U.S. consumers, he commented in an interview on Saturday, “I couldn’t care less if they raise prices, because people are going to start buying American cars.”
Hopes for a quick ceasefire in the Russia-Ukraine war also appear diminished after President Trump said he was “pissed off” by Putin’s questioning Ukrainian president Zelensky’s legitimacy and threatened secondary tariffs on buyers of Russian crude. “If you buy oil from Russia, you can’t do business in the United States,” Trump said. “There will be a 25% tariff on all oil, a 25- to 50-point tariff on all oil.”
The open interest statistics for refined products show a markedly different behavior. The last edition of The Weekly Energy Market Situation highlighted falling open interest in diesel futures. The chart below shows RBOB gasoline futures now following suit. Total market open interest for RBOB futures has fallen 4.97% over the last four trading days.
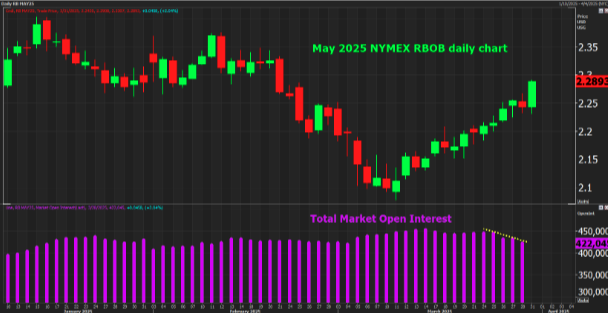
Source: LSEG
The divergence in the flow of funds may reflect the market assessing the impact of economic factors across different time frames. While tariffs may push crude prices higher in the short term, concerns about the effect of higher prices on consumer spending and layoffs in the public sector are manifesting in a weakening job market in the U.S.

Supply/Demand Balances
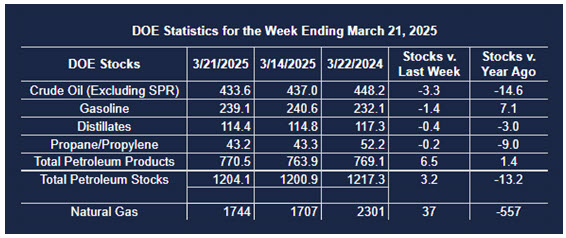
Supply/demand data in the United States for the week ended March 21, 2025, were released by the Energy Information Administration.
Total commercial stocks of petroleum increased (⬆) 3.2 million barrels to 1.2041 billion barrels during the week ended March 21st, 2025.
Commercial crude oil supplies in the United States were lower (⬇) by 3.3 million barrels from the previous report week to 433.6 million barrels.
Crude oil inventory changes by PAD District:
PADD 1: Down (⬇) 0.1 million barrels to 8.3 million barrels
PADD 2: Unchanged (=) at 105.5 million barrels
PADD 3: Down (⬇) 3.4 million barrels to 248.9 million barrels
PADD 4: Down (⬇) 0.1 million barrels to 24.6 million barrels
PADD 5: Up (⬆) 0.4 million barrels to 46.4 million barrels
Cushing, Oklahoma, inventories were down (⬇) 0.7 million barrels to 22.7 million barrels.
Domestic crude oil production increased (⬆) 1,000 barrels per day from the previous report at 13.574 million barrels per day.
Crude oil imports averaged 6.195 million barrels per day, a daily increase (⬆) of 810,000 barrels. Exports decreased (⬇) 35,000 barrels daily to 4.609 million barrels per day.
Refineries used 87.0% of capacity; an increase (⬆) of 0.1% from the previous report week.
Crude oil inputs to refineries increased (⬆) 87,000 barrels daily; there were 15.750 million barrels per day of crude oil run to facilities. Gross inputs, which include blending stocks, increased (⬆) 21,000 barrels daily to 15.970 million barrels daily.
Total petroleum product inventories increased (⬆) by 6.5 million barrels from the previous report week, up to 770.5 million barrels.
Total product demand decreased (⬇) 180,000 barrels daily to 19.237 million barrels per day.
Gasoline stocks decreased (⬇) 1.4 million barrels from the previous report week; total stocks are 239.1 million barrels.
Demand for gasoline decreased (⬇) 174,000 barrels per day to 8.643 million barrels per day.
Distillate fuel oil stocks decreased (⬇) 0.4 million barrels from the previous report week; distillate stocks are at 114.4 million barrels. EIA reported national distillate demand at 3.636 million barrels per day during the report week, a decrease (⬇) of 374,000 barrels daily.
Propane stocks fell (⬇) 0.2 million barrels from the previous report to 43.1 million barrels. The report estimated current demand at 1,091,000 barrels per day, an increase (⬆) of 160,000 barrels daily from the previous report week.
Natural Gas
U.S. natural gas inventories have started to refill at the earliest date since 2010. This year, working gas in storage started building on March 7th versus an average start date of March 31st.
Not only has the injection season started early, but the build also has been substantial. Working inventories increased by 46 billion cubic feet (bcf) over the two weeks ended on March 21st vs a ten-year average withdrawal of 79 bcf over the same time period.
Using the August NYMEX natural gas futures contract as a proxy for summer prices, resistance is found near the $4.80 price level. Market sentiment is marginally bearish until that level can be exceeded.
According to the EIA:
- Net injections into storage totaled 37 Bcf for the week ended March 21, compared with the five-year (2020–24) average net withdrawals of 31 Bcf and last year’s net withdrawals of 30 Bcf during the same week. Working natural gas stocks totaled 1,744 Bcf, which is 122 Bcf (7%) lower than the five-year average and 557 Bcf (24%) lower than last year at this time.
- According to The Desk survey of natural gas analysts, estimates of the weekly net change to working natural gas stocks ranged from net injections of 16 Bcf to 46 Bcf, with a median estimate of 32 Bcf.
- The average rate of withdrawals from storage is 18% higher than the five-year average so far in the withdrawal season (November through March). If the rate of withdrawals from storage matched the five-year average of 0.6 Bcf/d for the remainder of the withdrawal season, the total inventory would be 1,738 Bcf on March 31, which is 122 Bcf lower than the five-year average of 1,860 Bcf for that time of year.
Was this helpful? We’d like your feedback.
Please respond to [email protected]
This material has been prepared by a sales or trading employee or agent of Powerhouse Brokers, LLC and is, or is in the nature of, a solicitation. This material is not a research report prepared by Powerhouse Brokers, LLC. By accepting this communication, you agree that you are an experienced user of the futures markets, capable of making independent trading decisions, and agree that you are not, and will not, rely solely on this communication in making trading decisions.
DISTRIBUTION IN SOME JURISDICTIONS MAY BE PROHIBITED OR RESTRICTED BY LAW. PERSONS IN POSSESSION OF THIS COMMUNICATION INDIRECTLY SHOULD INFORM THEMSELVES ABOUT AND OBSERVE ANY SUCH PROHIBITION OR RESTRICTIONS. TO THE EXTENT THAT YOU HAVE RECEIVED THIS COMMUNICATION INDIRECTLY AND SOLICITATIONS ARE PROHIBITED IN YOUR JURISDICTION WITHOUT REGISTRATION, THE MARKET COMMENTARY IN THIS COMMUNICATION SHOULD NOT BE CONSIDERED A SOLICITATION.
The risk of loss in trading futures and/or options is substantial and each investor and/or trader must consider whether this is a suitable investment. Past performance, whether actual or indicated by simulated historical tests of strategies, is not indicative of future results. Trading advice is based on information taken from trades and statistical services and other sources that Powerhouse Brokers, LLC believes are reliable. We do not guarantee that such information is accurate or complete and it should not be relied upon as such. Trading advice reflects our good faith judgment at a specific time and is subject to change without notice. There is no guarantee that the advice we give will result in profitable trades.
Copyright 2025 Powerhouse Brokers, LLC, All rights reserved