Oil Price Declines Slow
- ULSD price recovers above $0.93
- U.S. product demand falls
- OPEC production expanding to support market share
- Natural gas production reached 92.2 Bcf/d in 2019

The Matrix
The past few weeks have been jaw-dropping in financial markets. The equites world experienced, according to one source, “the biggest one-day plunge ever in for the Dow Jones Industrial Average; followed by its biggest one-day gain since 1933.” This volatility carried over to energy futures where daily ranges expanded dramatically.
ULSD reached its most recent low on March 18, 2020. Prices fell to $0.9343 before consolidating. April ULSD settled just below $1.07 as the week of March 27 ended. The intensity of ULSD futures’ decline is easily seen on its’ price charts.
Powerhouse’s analysis of Elliott Wave calls the drop from $1.75 to March 18th’s low a third wave complete. Third waves are “strong and broad.”
The importance of this for the practical oil man is that a completed third wave could signify the end of intense price movement – at least for now. A new low is not out of the question, but it might not be reached so rapidly. The recovery now apparently underway, could still have room to run. ULSD now faces support at its $0.9343 low and then, $0.8487, a low previously established in January, 2016.
Arguments for further price softness are supported by reductions in global demand. Current evidence for that view are seen in the EIA Weekly Supply/Demand Estimates for the week ending March 20. Total demand for products in the United States were put at 19.4 million barrels daily. The decline from the previous week was 2.1 million barrels per day. Every product class showed declines. Gasoline was hit hardest, with a loss of nearly 900,000 barrels daily during the week. Other Oils, a residual product class, lost 600,000 barrels per day. Propane demand was not affected.
Plans by some OPEC members to boost supply by expanding market share are bearish for price, too. “EIA forecasts OPEC crude oil production will average 29.2 million barrels per day (b/d) from April through December 2020, up from an average of 28.7 million b/d in the first quarter of 2020.”
Supply/Demand Balances
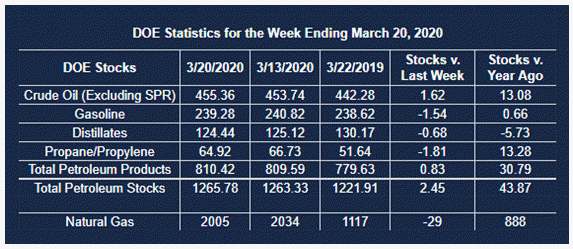
Supply/demand data in the United States for the week ending March 20, 2020, were released by the Energy Information Administration.
Total commercial stocks of petroleum rose 2.4 million barrels during the week ending March 20, 2020.
Commercial crude oil supplies in the United States increased by 1.6 million barrels from the previous report week to 455.4 million barrels. Crude oil inventory changes by PAD District:
PADD 1: Up 0.2 million barrels to 11.3 million barrels
PADD 2: Plus 2.3 million barrels to 129.7 million barrels
PADD 3: Down 2.6 million barrels to 241.3 million barrels
PADD 4: Plus 0.7 from the previous report week at 20.3 million barrels
PADD 5: Plus 1.0 million barrels to 51.7 million barrels
Cushing, Oklahoma inventories were up 0.9 million barrels from the previous report week to 39.3 million barrels.
Domestic crude oil production fell 100,000 barrels per day from the previous report week to 13.0 million barrels daily.
Crude oil imports averaged 6.117 million barrels per day, a daily decrease of 422,000 barrels. Exports declined 528,000 barrels daily to 3.850 million barrels per day.
Refineries used 87.3 percent of capacity, unchanged from the previous report week.
Crude oil inputs to refineries increased 18,000 barrels daily; there were 15.838 million barrels per day of crude oil run to facilities. Gross inputs, which include blending stocks, fell 174,000 barrels daily to reach 16.417 million barrels daily.
Total petroleum product inventories fell 0.8 million barrels from the previous report week.
Gasoline stocks decreased 1.5 million barrels daily from the previous report week; total stocks are 239.3 million barrels.
Demand for gasoline fell 859,000 barrels per day to 8.837 million barrels per day.
Total product demand decreased 2.078 million barrels daily to 19.400 million barrels per day.
Distillate fuel oil stocks decreased 0.7 million barrels from the previous report week; distillate stocks are at 124.4 million barrels. EIA reported national distillate demand at 3.795 million barrels per day during the report week, an decrease of 218,000 barrels daily.
Propane stocks decreased 1.8 million barrels from the previous report week; propane stocks are 64.9 million barrels. The report estimated current demand at 1.059 million barrels per day, a decrease of 20,000 barrels daily from the previous report week.
Natural Gas
The Energy Information Administration reported that production of dry natural gas in the United States averaged 92.2 Bcf per day in 2019. The agency expects a 3 percent increase in 2020. Nonetheless, the Short-Term Energy Outlook expects declining monthly output. This reflects expectations that low prices could inhibit new natural gas drilling in Appalachia. In the Permian, low prices “reduce associated gas output from oil-directed wells.”
The net withdrawal from storage totaled 29 Bcf for the week ending March 20, compared with the five-year (2015–19) average net withdrawal of 40 Bcf and last year’s net withdrawal of 39 Bcf during the same week. Working natural gas stocks totaled 2,005 Bcf, which is 292 Bcf more than the five-year average and 888 Bcf more than last year at this time.
The average rate of withdrawal from storage is 13% lower than the five-year average so far in the withdrawal season (November through March). If the rate of withdrawal from storage matched the five-year average of 1.4 Bcf/d for the remainder of the withdrawal season, the total inventory would be 1,989 Bcf on March 31, which is 292 Bcf higher than the five-year average of 1,697 Bcf for that time of year.
Futures trading involves significant risk and is not suitable for everyone. Transactions in securities futures, commodity and index futures and options on future markets carry a high degree of risk. The amount of initial margin is small relative to the value of the futures contract, meaning that transactions are heavily “leveraged”. A relatively small market movement will have a proportionately larger impact on the funds you have deposited or will have to deposit: this may work against you as well as for you. You may sustain a total loss of initial margin funds and any additional funds deposited with the clearing firm to maintain your position. If the market moves against your position or margin levels are increased, you may be called upon to pay substantial additional funds on short notice to maintain your position. If you fail to comply with a request for additional funds within the time prescribed, your position may be liquidated at a loss and you will be liable for any resulting deficit. Past performance may not be indicative of future results. This is not an offer to invest in any investment program.
Powerhouse is a registered affiliate of Coquest, Inc.
Was this helpful? We’d like your feedback.
Please respond to [email protected]
Copyright© 2020 Powerhouse, All rights reserved.