Tight Supply, Flat Crude Output, Bring Uncertainty to Prices
- Distillate inventory very low
- Geopolitical shifts are untested
- Unusual financial aspects of futures market administration
- EIA estimates 1.3 Tcf gas supply as the injection period begins.

Alan Levine—Chairman, Powerhouse
(202) 333-5380

The Matrix
ULSD remains the focus of anxiety in the U.S. petroleum product outlook. Powerhouse’s chart of domestic inventories tells much of the tale:

Distillate Fuel Stocks 2017 – 2022 Source: EIA, POWERHOUSE
Stocks of distillate fuel oils fell below the five-year low as 2022 opened. They have consistently moved lower since.
Tight stocks, when combined with efforts to reduce Russia’s hold on new supplies of crude oil and natural gas into the EU and coordinated efforts to redirect overseas supplies to the EU are a formula for price volatility and range.
Price expectations are also likely to be informed by thinner markets. Both volume and open interest have been declining. Exchanges and clearing members are raising margins, reflecting concern that high volatility could squeeze the finances of market participants.
With thin inventories, market flexibility could be inhibited should any interference to the distribution system occur.
New domestic crude oil supply, the source of most oil products, has offered little support to stability in our expanding economy. U.S. crude oil production was 11. 7 million barrels daily during the week ended January 7, 2022. Output fell to 11.6 million barrels per day over the next two weeks. It has remained at that level with only one weekly exception, ever since. (Product imports have remained steady in a range around 2.3 million barrels daily since 2011, a relatively small contribution to domestic requirements. Product exports have been growing, a loss to domestic availability. Exports were 5.7 million barrels daily for the week ended March 18, 2022.)
These data suggest higher and more volatile prices could lie ahead this year. At the same time, the possibility of a move lower cannot be excluded. The attitude that Covid is behind us has not reckoned with the most recent variant. Variant BA.2 is now showing its potential to overtake BA.1 leading to a new surge among unvaccinated and under vaccinated patients.
Supply/Demand Balances
Supply/demand data in the United States for the week ended March 18, 2022, were released by the Energy Information Administration.
Total commercial petroleum stocks fell 6.7 million barrels during the week ended March 18, 2022.
Commercial crude oil supplies in the United States decreased by 2.5 million barrels from the previous report week to 413.4 million barrels.
Crude oil inventory changes by PAD District:
PADD 1: Down 0.5 million barrels to 7.0 million barrels
PADD 2: Plus 2.0 million barrels to 103.0 million barrels
PADD 3: Down 6.5 million barrels to 228.1 million barrels
PADD 4: Plus 0.6 million barrels to 24.2 million barrels
PADD 5: Plus 2.0 million barrels to 51.1 million barrels
Cushing, Oklahoma, inventories grew 1.2 million barrels from the previous report week to 25.2 million barrels.
Domestic crude oil production was unchanged from the previous report week at 11.6 million barrels daily.
Crude oil imports averaged 6.486 million barrels per day, a daily increase of 92,000 barrels. Exports increased by 908,000 barrels daily to 3.844 million barrels per day.
Refineries used 91.1% capacity; 0.7 percentage points higher than the previous report week.
Crude oil inputs to refineries increased 277,000 barrels daily; 15.878 million barrels per day of crude oil run to facilities. Gross inputs, including blending stocks, rose 121,000 barrels daily to 16.280 million barrels.
Total petroleum product inventories fell 14.2 million barrels to 713.4 barrels from the previous report week.
Total product demand increased 472,000 barrels daily to 21.124 million barrels.
Gasoline stocks decreased by 2.9 from the previous report week; total stocks are 238.0 million barrels.
Gasoline demand slipped by 307,000 barrels per day to 8.637 million barrels per day.
Distillate fuel oil stocks decreased 2.1 million barrels from the previous report week; distillate stocks are at 112.1 million barrels. EIA reported national distillate demand at 4.516 million barrels per day during the report week, an increase of 812,000 barrels daily.
Propane stocks increased 0.3 million barrels from the previous report week; propane stocks are at 33.6 million barrels. The report estimated current demand at 1.340 million barrels per day, decreasing 192,000 barrels daily from the previous report week.
Natural Gas
The withdrawal period from underground natural gas storage ends in just a couple of days, on March 31. The surplus seen at the beginning of 2022 has become a shortfall, but none so serious that prices should be affected in any major way. EIA estimates 1.3 Tcf supply as the injection period begins. The more serious concern for natural gas planners is the growing importance of LNG exports, chronicled extensively in Powerhouse’s Weekly report.
Most American LNG exports have been spoken for this year. An arrangement for the U.S. to provide an additional 15 billion cubic meters to the EU implies a redirection of supply more than new sources. The object is to end all imports of Russian fossil fuels by 2027. This implies higher prices to attract alternatives to the EU. Ukraine’s situation has altered the state of geopolitics in Europe –Russia is demanding payment in rubles for its sales of natural gas to Europe. Russia is, effectively, requiring European buyers to prop up its currency. The ruble took a major hit as sanctions took hold. Germany and Italy (another major customer of Gazprom) effectively rejected this demand. This implications for further chaos in supply are only now emerging, with few intermediaries capable of accommodating this change in the short term.
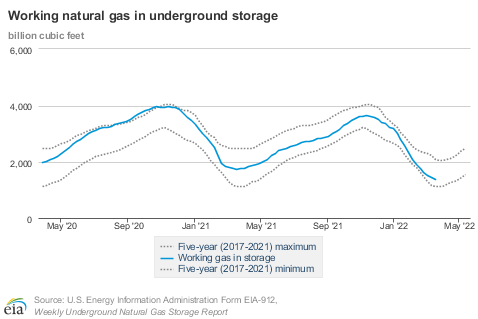
Natural Gas Storage 2017 – 2022 Source:
EIA According to the EIA:
The net withdrawals from storage totaled 51 Bcf for the week ended March 18, compared with the five-year (2017–2021) average net withdrawals of 62 Bcf and last year’s net withdrawals of 29 Bcf during the same week. Working natural gas stocks totaled 1,389 Bcf, which is 293 Bcf lower than the five-year average and 366 Bcf lower than last year at this time.
The average rate of withdrawals from storage is 9% higher than the five-year average up to this point in the withdrawal season (November through March). If the rate of withdrawals from storage matched the five-year average of 1.2 Bcf/d for the remainder of the withdrawal season, the total inventory would be 1,373 Bcf on March 31, which is 293 Bcf lower than the five-year average of 1,666 Bcf for that time of year.
Was this helpful? We’d like your feedback.
Please respond to [email protected]
Powerhouse Futures & Trading Disclaimer
Copyright 2021 Powerhouse Brokerage, LLC, All rights reserved