Gasoline Price Moving Higher, Pointing Towards Last Summer’s High
- Dramatic loss of gasoline inventories
- Commercial inventory levels moving lower
- Propane alone appears to be adequately supplied
- Natural gas pricing showing contradictory signals
Sincerely,
Alan Levine, Chairman
Powerhouse
(202) 333-5380

The Matrix
RBOB spot futures were the bullish standout for petroleum prices last week. Stocks fell dramatically. The nation lost 5.7 million barrels of gasoline supply for the week ended March 8. More than half of that was on the East Coast, where 3.4 million barrels were taken from inventories. Exports grew 217,000 barrels daily during the report week, to nearly 1 million barrels daily. Refiners added nearly 400,000 barrels daily of crude oil to operations, explaining why refinery use rates rose 1.9 percentage points for the week.
A shortfall in operations, reflecting facility outages due to the severe Gulf Coast winter, had a measurable impact on price. According to AAA, the national cost of a gallon of gasoline has risen over 9% since the start of 2024, as high as it has been since last November. Spot RBOB futures prices settled at $2.7068 per gallon.
Last summer’s high was $2.9966 in late July. This is a logical objective given the economy’s strength in manufacturing production, which rose +0.8% last month, well above expectations and the largest gain in 10 months.”
Crude oil and ULSD arguably had “inside” weeks. This week, however, both contracts registered recent highs. This is consistent with gains in RBOB and could signal a renewed move upward. Crude oil reached a level not seen since early November while ULSD ticked above mid-February highs.

Inventories of total petroleum (excluding the SPR) declined 4.7 million barrels during the week ended March 8, slightly lower than last year at this time. There are 1.218 billion barrels available commercially. At their peak, late August 2020, the county held 1.443 billion barrels for commercial use. This leaves us short in stocks of crude oil, gasoline and K-jet fuel, all with fewer than 30 days supply. Distillates have 31.6 days of supply. Propane/propylene stocks are enough for 45.7 days of supply. This reflects the substantial supply of natural gas, the source of propane.
Supply/Demand Balances
Supply/demand data in the United States for the week ended March 8, 2024, were released by the Energy Information Administration.
Total commercial stocks of petroleum fell (⬇) 4.7 million barrels to 1.2181 billion barrels during the week ended March 8, 2024.
Commercial crude oil supplies in the United States were fell (⬇) by 1.5 million barrels from the previous report week to 447.0 million barrels.
Crude oil inventory changes by PAD District:
PADD 1: Down (⬇) 0.2 million barrels 8.1 million barrels
PADD 2: Down (⬇) 0.9 million barrels to 117.3 million barrels
PADD 3: Up (⬆) 0.3 million barrels to 248.6 million barrels
PADD 4: Up (⬆) 0.6 million barrels to 25.8 million barrels
PADD 5: Down (⬇) 1.4 million barrels to 47.1 million barrels
Cushing, Oklahoma, inventories were down (⬇) 0.2 million barrels at 31.5 million barrels.
Domestic crude oil production was down (⬇) 100,000 barrels at 13.1 million barrels daily.
Crude oil imports averaged 5.491 million barrels per day, a daily decrease (⬇) of 1.730 million barrels. Exports decreased (⬇) 1.490 million barrels daily to 3.147 million barrels per day.
Refineries used 86.8% of capacity; 1.9 percentage points higher (⬆) than the previous report week.
Crude oil inputs to refineries increased (⬆) 390,000 barrels daily; there were 15.658 million barrels per day of crude oil run to facilities. Gross inputs, which include blending stocks, increased (⬆) 348,000 barrels daily to 15.923 million barrels daily.
Total petroleum product inventories decreased (⬇) by 3.2 million barrels from the previous report week, down to 771.1 million barrels.
Total product demand increased (⬆) 510,000 barrels daily to 20.803 million barrels per day.
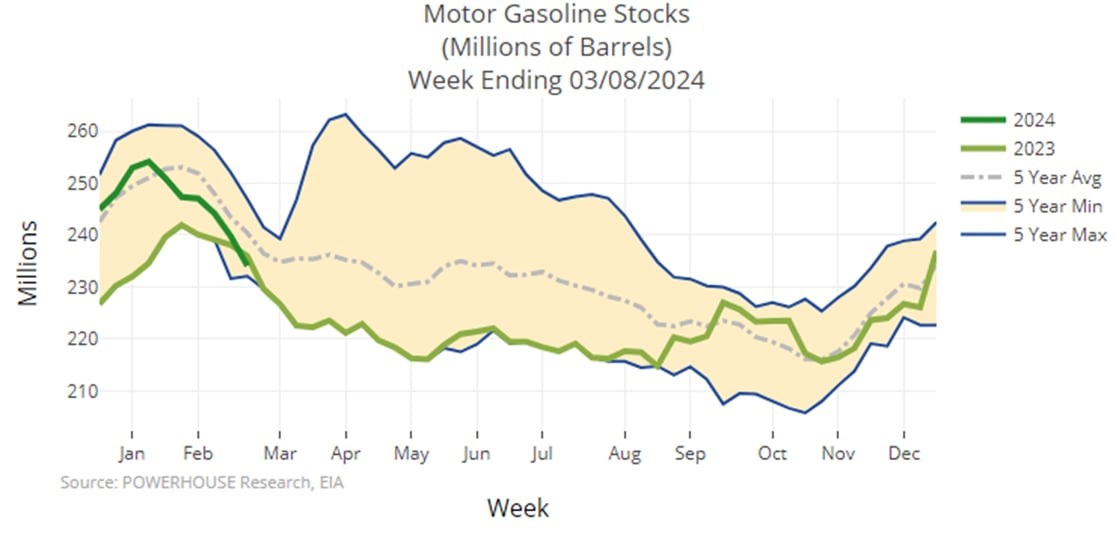
Gasoline stocks decreased (⬇) 5.7 million barrels from the previous report week; total stocks are 234.1 million barrels.
Demand for gasoline increased (⬆) 30,000 barrels per day to 9.044 million barrels per day.
Distillate fuel oil stocks increased (⬆) 0.9 million barrels from the previous report week; distillate stocks are at 117.9 million barrels. EIA reported national distillate demand at 3.375 million barrels per day during the report week, a decrease (⬇) of 700,000 barrels daily.
Propane stocks increased (⬆) by 0.7 million barrels from the previous week at 51.9 million barrels. The report estimated current demand at 1.236 million barrels per day, an increase (⬆) of 397,000 barrels daily from the previous report week.
Natural Gas
Front-month Henry Hub natural gas futures ended last week softly. Prices settled the week at $1.665, fully $0.14 below the week before, moving toward $1.511, the low from late February. As noted, disappointing Heating Degree Days for the winter now ended have suppressed demand, and growth in production contributed to the current situation. Moreover, constraints at LNG export facilities have thrown natural gas onto the domestic market, pressing on prices.
Spring is normally bullish for natural gas prices. This year, price charts have not offered much help to the bulls. Prices have traded generally flat to lower for the past year. Relative Strength Index has been moving lower since October, and stands now around 37.65, not an oversold reading. It still can move lower. There is no evidence of divergence with price either.
The Moving Average Convergence Divergence (MACD) is a measure of the momentum of trends. It compares two moving averages of price of different length. There has been little difference between a 12-day and 26-day average for many months now. But no significant directionality appears on the price chart.
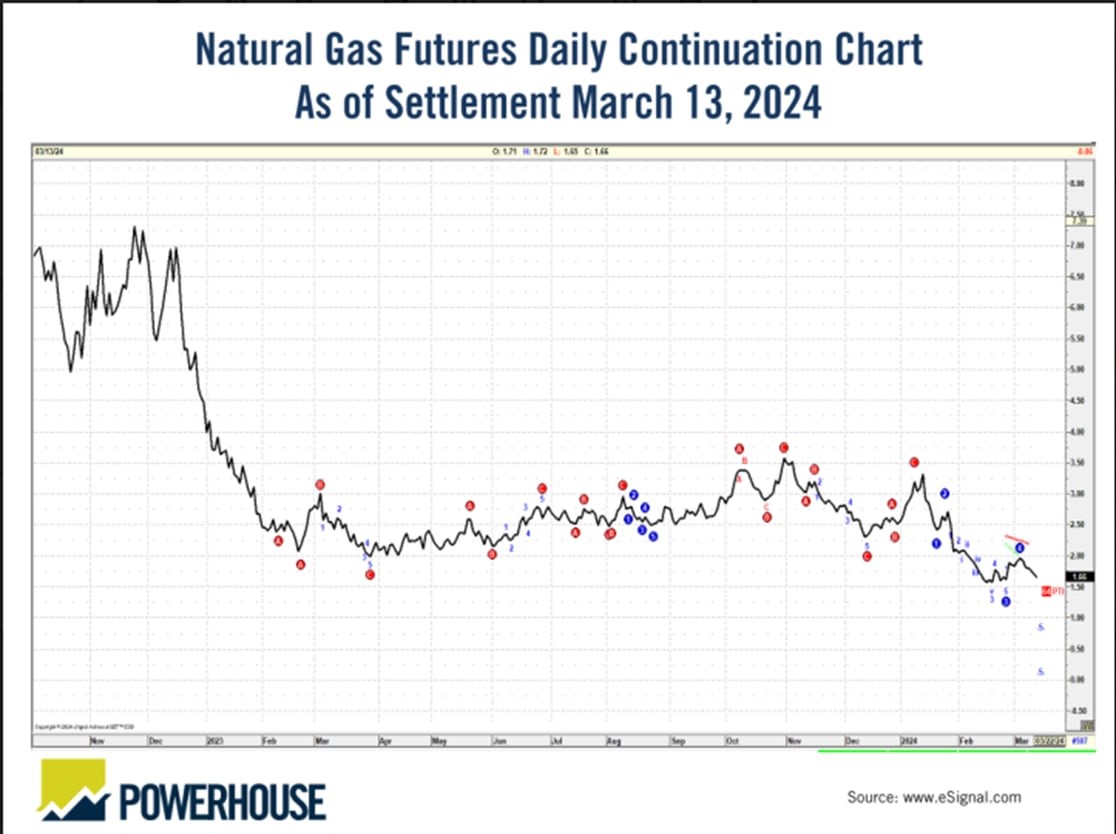
Finally, GET Chart patterns have not been very helpful to buyers. Our most recent analysis suggests the natural gas prices are still in a bearish situation. Fibonacci extensions suggest even the possibility that a $1.00 price could be tested.
Directional uncertainty in the short term is not likely to dim the longer-term outlook for natural gas. Growing interest in natural gas as a desirable fuel is evident both in the United States and overseas. Japan is a notable case. Arrangements with Russia are scheduled to end by the early 2030’s. Russia is Japan’s third largest supplier, behind Australia and Malaysia. As long-term contracts terminate, Japan sees the possibility of replacing them with supplies from political allies like Australia and the United States.
According to the EIA:
- Net withdrawals from storage totaled 9 Bcf for the week ended March 8, compared with the five-year (2019–2023) average net withdrawals of 87 Bcf and last year’s net withdrawals of 65 Bcf during the same week. Working natural gas stocks totaled 2,325 Bcf, which is 629 Bcf (37%) more than the five-year average and 336 Bcf (17% ) more than last year at this time.
- According to The Desk survey of natural gas analysts, estimates of the weekly net change to working natural gas stocks ranged from net withdrawals of 20 Bcf to net injections of 29 Bcf, with a median estimate of net withdrawals of 4 Bcf.
- The average rate of withdrawals from storage is 24% lower than the five-year average so far in the withdrawal season (November through March). If the rate of withdrawals from storage matched the five-year average of 2.7 Bcf/d for the remainder of the withdrawal season, the total inventory would be 2,262 Bcf on March 31, which is 629 Bcf higher than the five-year average of 1,633 Bcf for that time of year.
Was this helpful? We’d like your feedback.
Please respond to [email protected]
This material has been prepared by a sales or trading employee or agent of Powerhouse Brokers, LLC and is, or is in the nature of, a solicitation. This material is not a research report prepared by Powerhouse Brokers, LLC. By accepting this communication, you agree that you are an experienced user of the futures markets, capable of making independent trading decisions, and agree that you are not, and will not, rely solely on this communication in making trading decisions.
DISTRIBUTION IN SOME JURISDICTIONS MAY BE PROHIBITED OR RESTRICTED BY LAW. PERSONS IN POSSESSION OF THIS COMMUNICATION INDIRECTLY SHOULD INFORM THEMSELVES ABOUT AND OBSERVE ANY SUCH PROHIBITION OR RESTRICTIONS. TO THE EXTENT THAT YOU HAVE RECEIVED THIS COMMUNICATION INDIRECTLY AND SOLICITATIONS ARE PROHIBITED IN YOUR JURISDICTION WITHOUT REGISTRATION, THE MARKET COMMENTARY IN THIS COMMUNICATION SHOULD NOT BE CONSIDERED A SOLICITATION.
The risk of loss in trading futures and/or options is substantial and each investor and/or trader must consider whether this is a suitable investment. Past performance, whether actual or indicated by simulated historical tests of strategies, is not indicative of future results. Trading advice is based on information taken from trades and statistical services and other sources that Powerhouse Brokers, LLC believes are reliable. We do not guarantee that such information is accurate or complete and it should not be relied upon as such. Trading advice reflects our good faith judgment at a specific time and is subject to change without notice. There is no guarantee that the advice we give will result in profitable trades.
Copyright 2024 Powerhouse Brokers, LLC, All rights reserved