Tight Product Supply Meets Average Refinery Use
- Refiners conducting overdue maintenance
- Gasoline stocks generally tight; tepid price response last week
- LNG is natural gas’s agent of change
Sincerely,
Alan Levine, Chairman
Powerhouse
(202) 333-5380
The Matrix
Inputs of crude oil to refineries stood at 15 million barrels daily for the week ended March 3, 2023. This translated into refinery utilization of 86% of capacity for all United States refineries, about the same as the average of the past five years.

Gasoline is generally in tight supply. And with the driving season hard on us, the impact for prices could be strong.

This has not happened yet. Spot RBOB futures reached $2.81 early last week, but settled on Friday at $2.65 per gallon. And RBOB futures continue to make new lows. At writing, RBOB futures have moved below $2.5650.
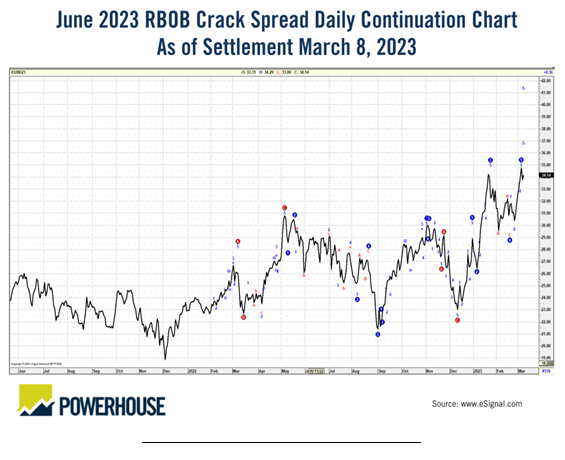
The June RBOB crack spread is trading just below $33.00 per barrel. This is high enough to encourage production of gasoline, but in conflict with the need for refinery maintenance which is inhibiting domestic supply. Technical charts point higher, challenging $37.00 or even $42.00 per barrel.
Supply/Demand Balances
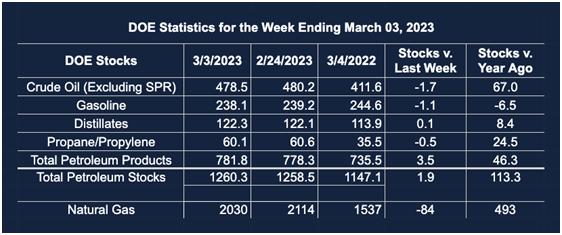
Supply/demand data in the United States for the week ended March 3, 2023, were released by the Energy Information Administration.
Total commercial stocks of petroleum rose (⬆) 1.9 million barrels to 1.260 billion barrels during the week ended March 3, 2023.
Commercial crude oil supplies in the United States were lower (⬇) by 1.7 million barrels from the previous report week to 478.5 million barrels.
Crude oil inventory changes by PAD District:
PADD 1: Down (⬇) 0.4 million barrels to 6.7 million barrels
PADD 2: Down (⬇) 0.3 million barrels to 128.3 million barrels
PADD 3: Plus (⬆) 2.7 million barrels to 269.9 million barrels
PADD 4: Down (⬇) 0.5 million barrels at 24.7 million barrels
PADD 5: Down (⬇) 3.1 million barrels to 49.0 million barrels
Cushing, Oklahoma, inventories were down (⬇) 0.9 million barrels from the previous report week to 39.8 million barrels.
Domestic crude oil production was down (⬇) from the previous report week at 12.2 million barrels daily.
Crude oil imports averaged 6.271 million barrels per day, a daily increase (⬆) of 63,000 barrels. Exports decreased (⬇) 2.267 million barrels daily to 3.362 million barrels per day.
Refineries used 86.0% of capacity; 0.2 percentage points higher (⬆) than the previous report week.
Crude oil inputs to refineries decreased (⬇) 12,000 barrels daily; there were 14.967 million barrels per day of crude oil run to facilities. Gross inputs, which include blending stocks, rose (⬆) 30,000 barrels daily to 15.480 million barrels daily.
Total petroleum product inventories rose (⬆) by 3.5 million barrels from the previous report week, rising to 781.8 million barrels.
Total product demand decreased (⬇) 1.364 million barrels daily to 19.049 million barrels per day.
Gasoline stocks decreased (⬇) 1.1 million barrels from the previous report week; total stocks are 238.1 million barrels.
Demand for gasoline decreased (⬇) 550,000 barrels per day to 8.562 million barrels per day.
Distillate fuel oil stocks increased (⬆) 0.1 million barrels from the previous report week; distillate stocks are at 122.3 million barrels. EIA reported national distillate demand at 3.514 million barrels per day during the report week, a decrease (⬇) of 322,000 barrels daily.
Propane stocks decreased (⬇) by 0.5 million barrels from the previous report week to 60.1 million barrels. The report estimated current demand at 1.234 million barrels per day, a decrease (⬇) of 109,000 barrels daily from the previous report week.
Natural Gas
Spot Henry Hub natural gas futures reacted bearishly to lower than normal Heating Degree Days. NOAA measured significant shortfalls among many regions for the week ended March 2. The East South Central region of the country failed normal by 77 HDDs, the South Atlantic are registered 61 fewer HDDs, and the populous Middle Atlantic region generated 12 fewer HDDs than normal.
Prices settled at $2.43, the low of last week. Values for end-2023 stood at $4.07, and end-2024 at $2.76. Buyers of distant contracts should be cautious without some indication of price bottoming near term.
The action in natural gas markets continues to focus on exports of liquefied natural gas (LNG.) Growth in LNG exports has been impressive. Starting in 2016, exports reached 10.6 Bcf/d last year. EIA projects outflow of 12.1 Bcf/d in 2023, (+14%,) and 0.7 more Bcf/d in 2024 (+5%.)
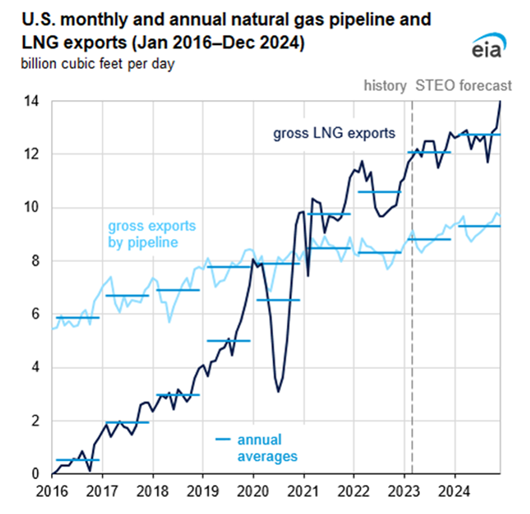
The dramatic increase reflects, of course, shifts in sources of European Union supplies. The United States has become a significant LNG source for European natural gas.
Europe’s gain in natural gas security has had some adverse impacts on clean climate aspirations. Less-wealthy Asian countries are seeking alternatives as cargoes are re-routed to the EU. Some have resorted to burning coal or are now enduring electrical blackouts.
According to the EIA:
The net withdrawals from storage totaled 84 Bcf for the week ended March 3, compared with the five-year (2018–2022) average net withdrawals of 101 Bcf and last year’s net withdrawals of 126 Bcf during the same week. Working natural gas stocks totaled 2,030 Bcf, which is 21% (359 Bcf) more than the five-year average and 32% (493 Bcf) more than last year at this time.
The average rate of withdrawals from storage is 24% lower than the five-year average so far in the withdrawal season (November through March). If the rate of withdrawals from storage matched the five-year average of 5.0 Bcf/d for the remainder of the withdrawal season, the total inventory would be 1,891 Bcf on March 31, which is 359 Bcf higher than the five-year average of 1,532 Bcf for that time of year.
Was this helpful? We’d like your feedback.
Please respond to [email protected]
Powerhouse Futures & Trading Disclaimer
Copyright 2023 Powerhouse Brokerage, LLC, All rights reserved