Oil Pricing More Reliant on Benchmark Plus Basis
- Basis spreads allow greater hedge control
- Three major benchmark crudes
- Basis spread futures contracts available for both crude and product hedging
- April natural gas withdrawal unprecedented

The Matrix
There are many varieties of crude oil. Their characteristics differ by things like sulphur content, viscosity, and specific gravity (API number.) These factors ultimately determine the worth of a barrel of oil. There are so many crude oil streams, however, that a pricing regimen of benchmarking various crude oils to an agreed upon standard crude oil has developed.
For all the many crude oils sold in the world, only three major crude oils are benchmarked: West Texas Intermediate, Brent Blend and Dubai. The values of other crudes (The Energy Intelligence Group has identified 195 major crude streams or blends) are priced as differences from these benchmarked crudes. (These differences are called “basis.”) Several “basis spreads” are gaining attention on NYMEX for crude oil and petroleum products.
Basis reflects all market influences other than the price of the underlying benchmark crude. Basis can be hedged by the use of spread futures. These track the price differences between Cushing OK, where WTI crude oil is priced and a local crude oil. This is a spread trade.
The center of domestic crude oil production is in Texas. The NYMEX offers many basis contracts to account for regional price differences. Two crude oil basis contracts are gaining particular interest on NYMEX screens: WTI Midland (Argus) symbol WTT and WTI Houston (Argus) symbol HTT.
There are similar basis spreads available in petroleum products as well. These include Gulf Coast ULSD (Platts) Up-Down Futures (symbol LT.) This relates prices on U.S. Gulf Coast ULSD (pipeline) to NYMEX futures. Another NY Harbor basis spread is NY ULSD (Argus) versus NYMEX futures. It is commonly used to hedge winter in the Northeast. Other basis spreads are Chicago ULSD (Platts) (symbol 5c.) There are gasoline basis spreads too.
Supply/Demand Balances
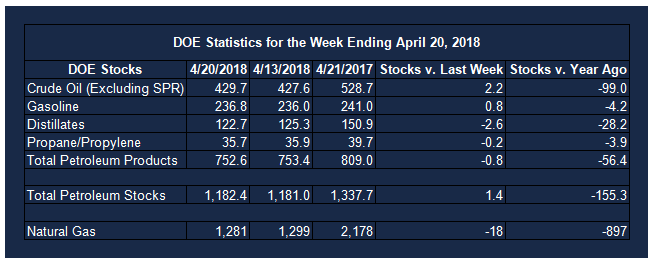
Supply/demand data in the United States for the week ending April 20, 2018 were released by the Energy Information Administration.
Total commercial stocks of petroleum rose 1.4 million barrels during the week ending April 20, 2018.
There were draws in stocks of distillates, residual fuel oil, and propane. There were builds in stocks of gasoline, fuel ethanol, K-jet fuel, and other oils.
Commercial crude oil supplies in the United States increased to 429.7 million barrels, a build of 2.2 million barrels.
Crude oil supplies increased in three of the five PAD Districts. PAD District 1 (East Coast) crude oil stocks advanced 0.4 million barrels, PADD 2 (Midwest) stocks rose 1.5 million barrels, and PADD 5 (West Coast) crude oil stocks increased 0.3 million barrels. Crude oil stocks at PADD 3 (Gulf Coast) and PADD 4 (Rockies) were unchanged from the previous report week.
Cushing, Oklahoma inventories increased 0.5 million barrels from the previous report week to 35.4 million barrels.
Domestic crude oil production increased 46,000 barrels daily to 10.586 million barrels per day from the previous report week.
Crude oil imports averaged 8.469 million barrels per day, a daily increase of 539,000 barrels. Exports rose 582,000 barrels daily to 2.331 million barrels per day.
Refineries used 90.8 per cent of capacity, a decrease of 1.6 percentage points from the previous report week.
Crude oil inputs to refineries decreased 328,000 barrels daily; there were 16.621 million barrels per day of crude oil run to facilities.
Gross inputs, which include blending stocks, declined 284,000 barrels daily to 16.867 million barrels daily.
Total petroleum product inventories saw an increase of 3.6 million barrels from the previous report week.
Gasoline stocks rose 0.8 million barrels from the previous report week; total stocks are 236.8 million barrels.
Demand for gasoline fell 774,000 barrels per day to 9.083 million barrels daily.
Total product demand decreased 2.434 million barrels daily to 19.000 million barrels per day.
Distillate fuel oil supply declined 2.6 million barrels from the previous report week to 122.7 million barrels. National distillate demand was reported at 3.749 million barrels per day during the report week. This was a weekly decrease of 607,000 barrels daily.
Propane stocks declined 0.2 million barrels from the previous report week; propane stock are 35.7 million barrels. Current demand is estimated at 884,000 barrels per day, a decrease of 170,000 barrels daily from the previous report week.
Natural Gas
According to the Energy Information Administration:
Working gas storage continues to post net withdrawals for the third week of the refill season. Net withdrawals from storage totaled 18 Bcf for the week ending April 20, compared with the five-year (2013–17) average net injections of 60 Bcf and last year’s net injections of 71 Bcf during the same week.
The natural gas storage refill season typically begins on April 1. However, colder-than-normal temperatures throughout most of the Lower 48 states have resulted in continued withdrawals from storage. This week’s report marks the third week in a row—and sixth time since 2010—that net withdrawals from storage on a national level were reported during April. Working gas stocks totaled 1,281 Bcf, which is 527 Bcf lower than the five-year average and 897 Bcf lower than last year at this time.
Continued April withdrawal activity is unprecedented. Net withdrawals from storage total 71 Bcf thus far in April. This is the first time in the history of the Weekly Natural Gas Storage Report, which dates back to 1994, that net withdrawals from storage continued during the first three weeks of April. Working gas stocks have not posted a net decline for the first month of the refill season since 1984 when net withdrawals totaling 74 Bcf were reported.
Futures trading involves significant risk and is not suitable for everyone. Transactions in securities futures, commodity and index futures and options on future markets carry a high degree of risk. The amount of initial margin is small relative to the value of the futures contract, meaning that transactions are heavily “leveraged”. A relatively small market movement will have a proportionately larger impact on the funds you have deposited or will have to deposit: this may work against you as well as for you. You may sustain a total loss of initial margin funds and any additional funds deposited with the clearing firm to maintain your position. If the market moves against your position or margin levels are increased, you may be called upon to pay substantial additional funds on short notice to maintain your position. If you fail to comply with a request for additional funds within the time prescribed, your position may be liquidated at a loss and you will be liable for any resulting deficit. Past performance may not be indicative of future results. This is not an offer to invest in any investment program.
Powerhouse is a registered affiliate of Coquest, Inc.
Was this memo helpful? We’d like your feedback.
Copyright © 2018 Powerhouse, All rights reserved.