

Markets Face Global Challenges, Economic and Demographic
- Product prices do not advance
- Chinese GDP struggles with low demand
- Population growth is falling
- Natural gas prices stagnate
Sincerely,
Alan Levine, Chairman
Powerhouse
(202) 333-5380

The Matrix
Petroleum product prices were tumultuous last week. Uncertainty about the outcome of the debt ceiling debate tossed market emotions back and forth. At the week’s end, product prices were a little lower. Daily price ranges were wide, and electronic bodies littered the Globex platform.
The July RBOB rally remains intact. RBOB bottomed at $2.2132 four weeks ago, rallying to $2.6239 during the week ended May 26. Last week, prices fell to a low of $2.4016, before settling at $2.5007.
Distillate fuel oil prices have charted a narrower and flatter course. Prices settled at $2.3569. A modestly bullish indication in the week’s trading was that the week’s low price was $2.2352. The week’s action showed a willingness to reject the low for a recovery nearer the week’s high ($2.3874.) A break of nearby resistance at $2.45 could thus invite new buying as fall buying is expected to begin soon.
WTI crude oil futures followed the pattern of distillates. Prices rejected the lows for the week, settling near the highs. A break of resistance at $74.75 could ignite buying in response to bullish efforts of OPEC+ and production limitations.
Broader global economics do not encourage a particularly optimistic view. Notably, China has fallen short in its efforts to recover from the pandemic. And comparisons with Covid-related slowdown data, while encouraging, can not mask current reality with gains achieved in the years 2010-2019, pre-Covid.
China’s own data showing 4.5% GDP growth, year-on-year, pale in comparison with the 7.2% average gain for that earlier period. Slow-growth China is setting a GDP target of 5% for 2023. The government notes a “complex global environment and insufficient domestic demand mean the foundation for the country’s recovery is “not yet solid.”
Other matters are pointing to slower growth too. Demographics are noting flat birth rates in the United States in 2022. “The government tallied about 655,000 fewer births in 2022 than the 2007 high of 4.32 million, reflecting ongoing decreases. With still-elevated deaths due in part to the latter phase of the Covid-19 pandemic, the U.S. in 2022 saw only about 385,000 more births than deaths,” according to the New York Times.
There are positive benefits to reduced population. A vibrant economy, however, needs demand. Lower population works against that objective.
Supply/Demand Balances
Supply/demand data in the United States for the week ended May 26, 2023, were released by the Energy Information Administration.
Total commercial stocks of petroleum rose (⬆) 11.3 million barrels to 1.2429 billion barrels during the week ended May 26, 2023.
Commercial crude oil supplies in the United States were higher (⬆) by 4.5 million barrels from the previous report week to 459.7 million barrels.
Crude oil inventory changes by PAD District:
PADD 1: Down (⬇) 1.2 million barrels at 8.1 million barrels
PADD 2: Up (⬆) 0.8 million barrels to 123.2 million barrels
PADD 3: Up (⬆) 4.3 million barrels to 249.0 million barrels
PADD 4: Down (⬇) 0.1 million barrels to 26.7 million barrels
PADD 5: Up (⬆) 0.8 million barrels to 52.7 million barrels
Cushing, Oklahoma, inventories were up (⬆) 1.7 million barrels from the previous report week to 38.9 million barrels.
Domestic crude oil production was down (⬇) 100,000 barrels at 12.2 million barrels daily.
Crude oil imports averaged 7.217 million barrels per day, a daily increase (⬆) of 1.367 million barrels. Exports increase (⬆) 366,000 barrels daily to 4.915 million barrels per day.
Refineries used 93.1% of capacity; 1.4 percentage points higher (⬆) than the previous report week.
Crude oil inputs to refineries increased (⬆) 96,000 barrels daily; there were 16.165 million barrels per day of crude oil run to facilities. Gross inputs, which include blending stocks, increased (⬆) 244,000 barrels daily to 16.784 million barrels daily.
Total petroleum product inventories increased (⬆) by 6.8 million barrels from the previous report week, up to 783.2 million barrels.
Total product demand decreased (⬇) 1.259 million barrels daily to 19.442 million barrels per day.
Gasoline stocks decreased (⬇) 0.2 million barrels from the previous report week; total stocks are 216.1 million barrels.
Demand for gasoline decreased (⬇) 339,000 barrels per day to 9.098 million barrels per day.
Distillate fuel oil stocks increased (⬆) 1.0 million barrels from the previous report week; distillate stocks are at 106.7 million barrels. EIA reported national distillate demand at 3.646 million barrels per day during the report week, a decrease (⬇) of 552,000 barrels daily.
Propane stocks increased (⬆) by 4.0 million barrels from the previous report week to 70.7 million barrels. The report estimated current demand at 687,000 barrels per day, a decreased (⬇) of 132,000 barrels daily from the previous report week.
Natural Gas
Markets are now in meteorological summer and at the start of the Atlantic Hurricane Season.
Degree days still fail to impress, with results for the week ended May 25th below last year and below normal experience for both heating and cooling. And with lower degree day readings, EIA reports lower demand in power generation, industrial, and residential/commercial sectors.
Hurricanes can initiate price action in natural gas, but this has not yet happened. This year, another weather phenomenon, El Nino, could inhibit storms. El Nino indicates warming sea surface temperatures in the equatorial Pacific. NOAA has assigned a 61% chance that El Nino will be fully in place by August.
Atlantic basin waters are also very warm this year. Sea Surface temperatures have reached 80 degrees. This could enhance hurricane activity.
This conflict makes hurricane prediction especially hazardous. Natural gas price action has itself made for difficult analysis.
The chart of daily prices for natural gas suggests the problem. Last week ended with spot (July) Henry Hub natural gas futures printing $2.172. And late in March, prices broke below $2.00. This apparently completed a five-wave Elliot Wave decline from $9.766, reached on August 23, 2022.
The 2022 high natural gas price reflected a freeze-in of U.S. production early in the year, accompanied by a substantial reduction in storage. LNG exports expanded as the United States responded to the Russian incursion into Ukraine, adding to price pressure. There were record summer power burns. Prices fell afterward as production recovered.
Powerhouse uses GET-Counted charts in its work frequently. GET is “Gann-Elliott Trader”, software that offers counts of Elliott Waves. These waves represent the thinking of R.N. Elliott. He used them to model human behavior through price activity.
Elliott suggests that natural gas prices have completed a five-wave pattern to a low. This could be followed by a period of consolidation before a new five-wave pattern emerges.
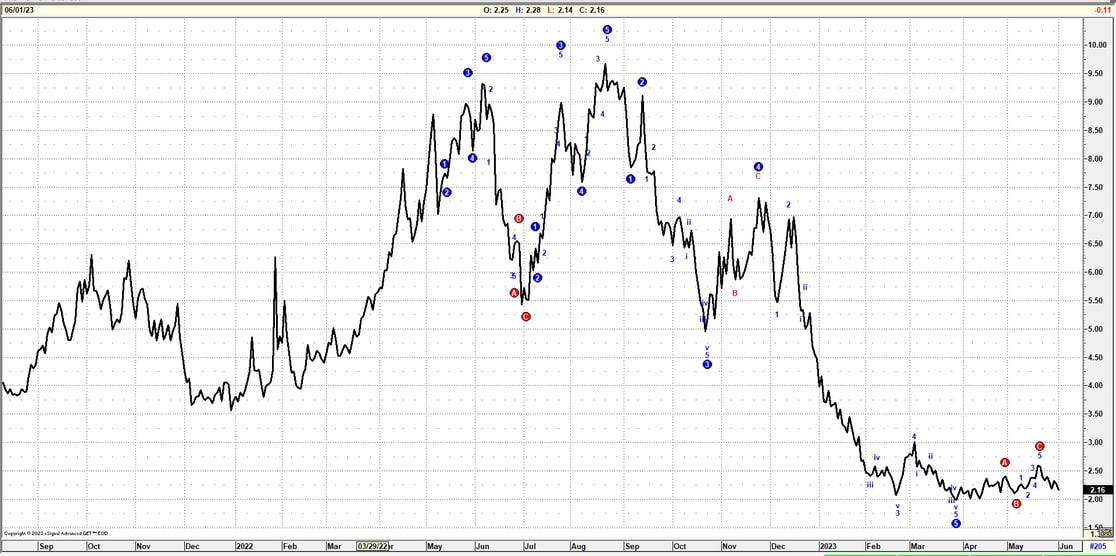
Natural gas markets tend to bottom during the summer and rally into fall. Prices are tracing a flat pattern with little sign of lifting. Statistics like RSI and MACD are not showing divergence. RSI is, however, oversold.
According to the EIA:
The net injections into storage totaled 110 Bcf for the week ended May 26, compared with the five-year (2018–2022) average net injections of 101 Bcf and last year’s net injections of 82 Bcf during the same week. Working natural gas stocks totaled 2,446 Bcf, which is 349 Bcf (17%) more than the five-year average and 557 Bcf (29%) more than last year at this time.
According to the Reuters survey of natural gas analysts, estimates of the weekly net change to working natural gas stocks ranged from net injections of 99 Bcf to 123 Bcf, with a median estimate of 106 Bcf.
The average rate of injections into storage is 9% higher than the five-year average so far in the refill season (April through October). If the rate of injections into storage matched the five-year average of 9.5 Bcf/d for the remainder of the refill season, the total inventory would be 3,944 Bcf on October 31, which is 349 Bcf higher than the five-year average of 3,595 Bcf for that time of year.
Was this helpful? We’d like your feedback.
Please respond to [email protected]
Powerhouse Futures & Trading Disclaimer
Copyright 2023 Powerhouse Brokerage, LLC, All rights reserved

