Global Economic Uncertainty Push Oil Prices Lower
- Welcome James Dorman as POWERHOUSE’s newest licensed Commodity Broker
- Inflation and interest rate increase fears re-emerge
- Expectations for Chinese demand growth soften
- Natural gas outlook turns bullish
Sincerely,
Alan Levine, Chairman
Powerhouse
(202) 333-5380

Powerhouse is proud to welcome James Dorman as its newest Licensed Commodity Broker. James has passed the National Commodity Futures Exam, (Series 3.) His achievement will allow him to help you plan, develop, and execute your trading needs. Many of you have already communicated with James on margin calls and fills. James is well-prepared to help you. He is a graduate of the University of Wisconsin-Madison with double majors in Economics and Political Science.
The Matrix
The week ended June 23, 2023, ended with prices under pressure. There were plenty of bullish signs, but hawkish interest rate expectations indicated by the Federal Reserve carried the week lower.
Ongoing inflation, of course, is the Fed’s major policy concern. Price-supportive oil inventory data were a highlight. Crude oil inventories in the United States fell 3.83 million barrels during the report week ended June 16. Smaller-than-expected increases in gasoline, (+479,000 barrels) and in distillate fuel oil stocks (+434,000 barrels) heightened the bullish tone.
Broader economic data offered mixed news. Domestic Initial Jobless Claims proved encouraging, as did sales of existing homes. But the Bank of England raised rates by 50 basis points. Elsewhere overseas, China’s demand for energy has fallen. Chinese analysts have cut demand growth forecasts to +3.5% for 2023 from +5.1%. And China’s crude oil inventories have risen to 966 million barrels. This is a two-year high, and much higher than the 858-million-barrel five-year average. Major banks have expressed concern over these data and have cut their own Chinese outlooks for GDP.
Crude oil supplies in floating storage, a global statistic unrelated to China, have risen more than 5% in the most recent report week to 107.1 million barrels. This adds to stocks and could press prices down further, especially if events involving producers take hold.
Iran, for example, has frustrated the objectives of U.S. sanctions and has seen crude oil exports and output rise to new highs this year. This has also countered an OPEC+ arrangement with Saudi Arabia that was to have reduced the group’s July output as a price-support measure.
This leaves us with a crude oil futures market that could break support of around $67. The next important level of support would be $63.71, the low from May 4. Support at $60 has been sustained since early 2021. A rally in prices cannot be ignored. The path higher faces formidable resistance. The crude oil markets would have to fight through a wall of adversity above $74 to move significantly higher.
Supply/Demand Balances
Supply/demand data in the United States for the week ended June 16, 2023, were released by the Energy Information Administration.
Total commercial stocks of petroleum rose (⬆) 1.3 million barrels to 1.2692 billion barrels during the week ended June 16, 2023.
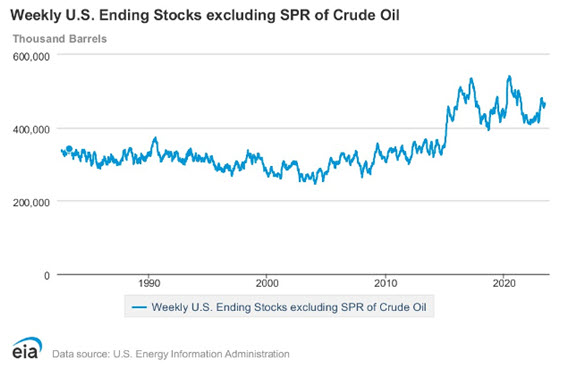
Commercial crude oil supplies in the United States were lower (⬇) by 3.8 million barrels from the previous report week to 463.3 million barrels.
Crude oil inventory changes by PAD District:
- PADD 1: Up (⬆) 0.5 million barrels at 8.2 million barrels
- PADD 2: Down (⬇) 0.8 million barrels to 125.9 million barrels
- PADD 3: Up (⬆) 0.6 million barrels to 254.9 million barrels
- PADD 4: Down (⬇) 0.6 million barrels at 25.5 million barrels
- PADD 5: Down (⬇) 3.5 million barrels to 48.8 million barrels
Cushing, Oklahoma, inventories were down (⬇) 0.1 million barrels from the previous report week to 42.0 million barrels.
Domestic crude oil production was down (⬇) 200,000 barrels at 12.2 million barrels daily.
Crude oil imports averaged 6.161 million barrels per day, a daily decrease (⬇) of 220,000 barrels. Exports increased (⬆) 1.273 million barrels daily to 4.543 million barrels per day.
Refineries used 93.1% of capacity; 0.6 percentage points lower (⬇) than the previous report week.
Crude oil inputs to refineries decreased (⬇) 116,000 barrels daily; there were 16.470 million barrels per day of crude oil run to facilities. Gross inputs, which include blending stocks, decreased (⬇) 103,000 barrels daily to 17.011 million barrels daily.
Total petroleum product inventories increased (⬆) by 5.1 million barrels from the previous report week, up to 805.9 million barrels.
Total product demand increased (⬆) 517,000 barrels daily to 20.925 million barrels per day.
Gasoline stocks increased (⬆) 0.5 million barrels from the previous report week; total stocks are 221.4 million barrels.
Demand for gasoline increased (⬆) 182,000 barrels per day to 9.375 million barrels per day.
Distillate fuel oil stocks increased (⬆) 0.4 million barrels from the previous report week; distillate stocks are at 114.3 million barrels. EIA reported national distillate demand at 3.978 million barrels per day during the report week, an increase (⬆) of 403,000 barrels daily.
Propane stocks increased (⬆) by 1.5 million barrels from the previous report week to 77.0 million barrels. The report estimated current demand at 1.036 million barrels per day, an increase (⬆) of 467,000 barrels daily from the previous report week.
Natural Gas
Henry Hub natural gas spot futures settled at $2.73 for the week ended June 23, 2023. June has generally had prices rising, with the month beginning at $2.16. Values increased more than 26% during the period. Moreover, $2.73 represented a new high for the rally, opening the way toward $3.14, last seen on March 3, 2023
The rally reflected, at least in part, a normal seasonal move. Buyers are now locking in prices for next winter, and with $2.00 support holding solidly, the opportunity for buyers may be now.
Weather expectations have shifted in favor of more demand in the second half of 2023. Pipeline exports to Mexico increased too. There was more than enough outflow to overcome maintenance issues inhibiting exports of LNG.
The supply issues facing the EU remain in place. Warmer weather eased seasonal demand in the region last winter, but Russia is still under sanction and the United States will be relied upon for alternative gas supply. EIA projects an increase in gas demand as the economy recovers from the pandemic. Natural gas is seen as more climate-friendly and is being favored by many governments.
The pressure to install natural gas as the global fuel of choice also conduces to higher prices. And efforts to provide a robust distribution system have made the product easier to transport and store.
According to the EIA:
Net injections into storage totaled 95 Bcf for the week ended June 16, compared with the five-year (2018–2022) average net injections of 86 Bcf and last year’s net injections of 76 Bcf during the same week. Working natural gas stocks totaled 2,729 Bcf, which is 362 Bcf (15%) more than the five-year average and 571 Bcf (26%) more than last year at this time.
According to The Desk survey of natural gas analysts, estimates of the weekly net change to working natural gas stocks ranged from net injections of 88 Bcf to 98 Bcf, with a median estimate of 91 Bcf.
The average rate of injections into storage is 8% higher than the five-year average so far in the refill season (April through October). If the rate of injections into storage matched the five-year average of 9.0 Bcf/d for the remainder of the refill season, the total inventory would be 3,957 Bcf on October 31, which is 362 Bcf higher than the five-year average of 3,595 Bcf for that time of year.
Was this helpful? We’d like your feedback.
Please respond to [email protected]
Powerhouse Futures & Trading Disclaimer
Copyright 2023 Powerhouse Brokerage, LLC, All rights reserved