Oh, What a Relief It Ain’t
- US gasoline stocks still moving lower
- Proposed limits on gasoline exports could be contradictory
- New gasoline supply from refineries seems unlikely
- LNG exports from Freeport need a home domestically.
Sincerely,
Alan Levine, Chairman
Powerhouse
(202) 333-5380
The Matrix
Relief at the gas pump is an imperative for the Biden administration. It could also help consumers, for whom gasoline prices take a bigger piece of the family paycheck than they did in January 1998. (Last week, we discussed the situation now, in which gasoline is more than 1.5 times as large a share of disposable income per capita as nearly 25 years ago, despite advances in technology.)

Current statistics suggest it will take more than an Alka-Seltzer to bring relief.
Gasoline stocks continued their downward trajectory during the week ended June 10. Inventories of gasoline fell on the US East Coast and were unchanged elsewhere in the country.

US Gasoline Stocks – 5-year Trend 2017 – 2022 Source: EIA, POWERHOUSE
The situation on the US East Coast is becoming more difficult for drivers at a time when inventories are typically on the rise.
PADD I (East Coast), with small refinery capacity anyway, supplements supply by imports. Last week, however, gasoline imports to PADD I fell by more than 40% to 635.000 barrels per day. And last year imports reached 1.1 million barrels daily for the comparable week.
Refining has added to the problem. Facilities are operating at 98.3% of capacity already, an ultimately unsustainable level. Nationally, refinery use was 93.7% of capacity, slightly lower than the previous week. However, the shortage of refinery capacity is a global problem, with more than 3 million barrels per day (bpd) offline since the onset of the pandemic.
Trade sources have been buzzing about the possibility of restricting exports of gasoline and diesel as one way to provide supply and restrain the price of gasoline. (Emergency use of the Defense Production Act is reportedly available for the government’s use.)
No date for implementation of a limit has been proposed. Nevertheless, it has raised objections because of conflicts with other national priorities. These include commitments to assist EU with enough energy in light of Ukraine. Environmental efforts could be at stake too. These include waiver of anti-pollution rules requiring low RVP in the summer. Blenders might be allowed to use butane, a lower-cost blend stock.
Supply/Demand Balances
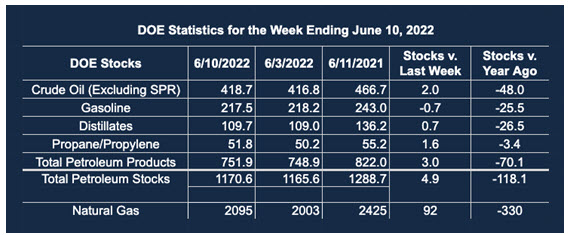
Supply/demand data in the United States for the week ended June 10, 2022, were released by the Energy Information Administration.
Total commercial stocks of petroleum grew 11 million barrels during the week ended June 10, 2022.
Commercial crude oil supplies in the United States increased by 2 million barrels from the previous report week to 418.7 million barrels.
Crude oil inventory changes by PAD District:
PADD 1: Minus 0.1 million barrels to 7.3 million barrels
PADD 2: Minus 1.4 million barrels to 102.4 million barrels
PADD 3: Plus 2.0 million barrels to 237.4 million barrels
PADD 4: Down 0.3 million barrels to 25 million barrels
PADD 5: Plus 1.8 million barrels to 46.9 million barrels
Cushing, Oklahoma, inventories were down 0.8 million barrels from the previous report week to 22.6 million barrels.
Domestic crude oil production was up 100,000 barrels from the previous report week to 12 million barrels daily.
Crude oil imports averaged 6.985 million barrels per day, a daily increase of 831,000 barrels. Exports increased 1.493 million barrels daily to 3.725 million barrels per day.
Refineries used 93.7% of capacity; 0.5 percentage points lower than the previous report week.
Crude oil inputs to refineries decreased 67,000 barrels daily; there were 16.320 million barrels per day of crude oil run to facilities. Gross inputs, which include blending stocks, fell 95,000 barrels daily to 16.809 million barrels daily.
Total petroleum product inventories added 2.9 million barrels from the previous report week, rising to 751.3 million barrels.
Total product demand decreased 524,000 thousand barrels daily to 19.703 million barrels per day.
Gasoline stocks decreased 0.7 million barrels from the previous report week; total stocks are 217.5 million barrels.
Demand for gasoline fell 106,000 barrels per day to 9.093 million barrels per day.
Distillate fuel oil stocks increased 0.7 million barrels from the previous report week; distillate stocks are at 109.7 million barrels. EIA reported national distillate demand at 3.619 million barrels per day during the report week, a decrease of 31,000 barrels daily.
Propane stocks increased 1.6 million barrels from the previous report week; propane stocks are at 51.8 million barrels. The report estimated current demand at 0.841 million barrels per day, a decrease of 525,000 barrels daily from the previous report week.
Natural Gas
The most recent injection data suggests that underground natural storage could begin the 2022-23 withdrawal period in November with 3.3 Tcf available. This does not account for a fire at the Freeport LNG export terminal. This accident, on June 8, 2022, is expected to reduce 17% of US export capacity, about two Bcf/d.
Overseas outlets are being denied for now, and the stranded natural gas may have to find markets here, at home. This is particularly troublesome because 71% of Freeport exports this year had been shipped to Europe. It could seriously affect the efforts of the European Union to reduce its reliance on Russian supplies.
According to the EIA:
Net [natural gas] injections into storage totaled 92 Bcf for the week ended June 10, compared with the five-year (2017–2021) average net injections of 79 Bcf and last year’s net injections of 28 Bcf during the same week. Working natural gas stocks totaled 2,095 Bcf, which is 323 Bcf lower than the five-year average and 330 Bcf lower than last year at this time.
The average rate of injections into storage is 6% lower than the five-year average so far in the refill season (April through October). If the rate of injections into storage matched the five-year average of 8.6 Bcf/d for the remainder of the refill season, the total inventory would be 3,322 Bcf on October 31, which is 323 Bcf lower than the five-year average of 3,645 Bcf for that time of year.
Was this helpful? We’d like your feedback.
Please respond to [email protected]
Powerhouse Futures & Trading Disclaimer
Copyright 2022 Powerhouse Brokerage, LLC, All rights reserved