Oil Prices Continue to Move Higher
- Oil prices trading well below last year
- RBOB rallies on growing bullish open interest
- High gasoline gross margins support rally
- Natural gas sees many records in 2018

The Matrix
Current petroleum futures prices are trading well below their levels one year ago. WTI crude oil is valued nearly $12 under its last January price. ULSD futures are trading nearly twenty cents below their comparable level last year at this time. RBOB in particular lags last year’s level by forty-two cents. Such steep discounts come when prices are likely near annual lows. And Powerhouse has already suggested that an annual low may already be set for 2019. (See Weekly Energy Situation, January 7, 2019.)
These considerations have attracted considerable interest from industry buyers, especially RBOB interests. Open Interest in RBOB, the number of active futures contracts, has been rising since the beginning of the year. Open interest in RBOB bottomed at year-end with 390,000 active RBOB contracts. Open interest rose more than six per cent in the next two weeks, reaching 415,000 gasoline contracts. RBOB prices have rallied through the period, emphasizing the bullish pattern.
U.S. gasoline retailers have just experienced the “strongest rack-to-retail margins so far in the 21st century,” according to a leading national price collection service. Margins over the past five years have averaged 21.6 cents per gallon. This compares with margins averaging 14.6 cents per gallon in the first decade of the 21st century. The attack on margins by super retail chains seeking market share appears to have abated.
ULSD prices have rallied around twenty cents during this early New Year period. After an increase in open interest to 376,000 contracts, the number of active contacts has fallen to 361,000 ULSD futures. This suggests that a period of short covering may be underway. Prices move higher as short traders buy positions back. This need not herald a down-turn in ULSD prices. They may take their cue from RBOB and continue to advance. Powerhouse’s Current Comments (January 11, 2019) observed that the “forecast is much colder than previous forecasts across north-central US and Canada.”
Supply/Demand Balances
Supply/demand data in the United States for the week ending January 04, 2019 were released by the Energy Information Administration.
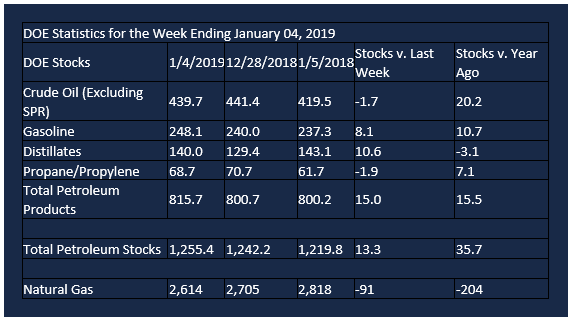
Total commercial stocks of petroleum increased 13.3 million barrels during the week ending January 04, 2019.
There were builds in stocks of gasoline, fuel ethanol, distillates, and residual fuel. There were draws in stocks of K-jet fuel, propane, and other oils.
Commercial crude oil supplies in the United States decreased 1.7 million barrels from the previous report week to 439.7 million barrels.
Crude oil supplies increased in two of the five PAD Districts. PADD 2 (Midwest) crude oil stocks grew 1.2 million barrels and PADD 5 (West Coast) stocks rose 1.2 million barrels. PADD 1 (East Coast) stocks declined 0.1 million barrels, PADD 3 (Gulf Coast) stocks fell 3.0 million barrels, and PADD 4 (Rockies) stocks decreased 1.2 million barrels.
Cushing, Oklahoma inventories increased 0.4 million barrels from the previous report week to 42.3 million barrels.
Domestic crude oil production was unchanged from the previous report week at 11.7 million barrels per day.
Crude oil imports averaged 7.846 million barrels per day, a daily increase of 454,000 barrels per day. Exports fell 172,000 barrels daily to 2.065 million barrels per day.
Refineries used 96.1 per cent of capacity, a decrease of 1.1 percentage points from the previous report week.
Crude oil inputs to refineries decreased 194,000 barrels daily; there were 17.760 million barrels per day of crude oil run to facilities. Gross inputs, which include blending stocks, fell 194,000 barrels daily to 17.883 million barrels daily.
Total petroleum product inventories grew 15.0 million barrels from the previous report week.
Gasoline stocks increased 8.1 million barrels from the previous report week; total stocks are 248.1 million barrels.
Demand for gasoline increased 112,000 barrels per day to 8.735 million barrels per day.
Total product demand increased 708,000 barrels daily to 19.764 million barrels per day.
Distillate fuel oil stocks increased 10.6 million barrels from the previous report week; distillate stocks are at 140.0 million barrels. National distillate demand was reported at 2.955 million barrels per day during the report week. This was a weekly decrease of 248,000 barrels daily.
Propane stocks decreased 1.9 million barrels from the previous report week; propane stock are 68.7 million barrels. Current demand is estimated at 1.526 million barrels per day, a decrease of 59,000 barrels daily from the previous report week.
Natural Gas
Natural gas experienced several firsts in 2018. Production of natural gas achieved record highs, reflecting gains in the Appalachian, the Haynesville and Permian Basin. Consumption of natural gas reached new highs in 2018 too. The increases were largely in electric power, where gas and renewables displaced coal-fired generation. Gains were also recorded in industrial, residential and commercial applications. Exports also reached new highs. Liquefied Natural Gas (LNG) and exports to Mexico accounted for the gain.
According to EIA:
Net withdrawals from storage totaled 91 Bcf for the week ending January 4, compared with the five-year (2014–18) average net withdrawals of 187 Bcf and last year’s net withdrawals of 337 Bcf during the same week. Working gas stocks totaled 2,614 Bcf, which is 464 Bcf lower than the five-year average and 204 Bcf lower than last year at this time.
The average rate of net withdrawals from storage is 22% lower than the five-year average so far in the withdrawal season (November through March).
Natural gas prices reacted bearishly to these data. Technical analysts place support around $2.79. Break of this level opens the way to around $2.50.
Futures trading involves significant risk and is not suitable for everyone. Transactions in securities futures, commodity and index futures and options on future markets carry a high degree of risk. The amount of initial margin is small relative to the value of the futures contract, meaning that transactions are heavily “leveraged”. A relatively small market movement will have a proportionately larger impact on the funds you have deposited or will have to deposit: this may work against you as well as for you. You may sustain a total loss of initial margin funds and any additional funds deposited with the clearing firm to maintain your position. If the market moves against your position or margin levels are increased, you may be called upon to pay substantial additional funds on short notice to maintain your position. If you fail to comply with a request for additional funds within the time prescribed, your position may be liquidated at a loss and you will be liable for any resulting deficit. Past performance may not be indicative of future results. This is not an offer to invest in any investment program.
Powerhouse is a registered affiliate of Coquest, Inc.
Was this helpful? We’d like your feedback.
Please respond to [email protected]
Copyright © 2019 Powerhouse, All rights reserved.