Oil Fundamentals Turn Bearish
- U.S. economy could decline by 6.5% in 2020: Fed
- Oil stocks still expanding
- ULSD support at $1.0275
- Natural gas storage could start November withdrawals at a record level

The Matrix
The Federal Reserve believes the economy of the United States will decline 6.5% in 2020. The Fed sees a weak economy through at least 2022. Supporting this expectation was a projection that unemployment was likely to reach 9.3% by year-end. Moreover, that it could take “years” to recover.
These forecasts came on top of significant supply availability. One bank analysis noted that U. S. shale oil production was coming back on line as some producers opened previously shut-in wells. Additional production from Libya could add 800,000 barrels daily to supply.
These expected gains in supply could offset OPEC+ producers’ agreements to contain crude oil output. The group agreed in April to cut 9.7 million barrels daily of crude oil production. They have since agreed to extend this cut through July.
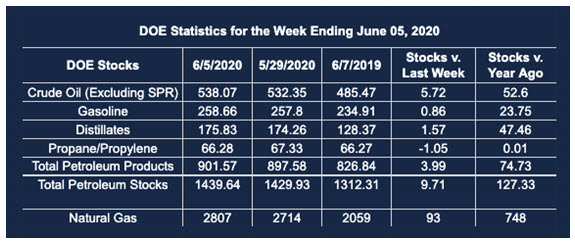
Oil futures prices reacted bearishly to the Federal Reserve projections and the most recent EIA supply/demand balance report for the week ending June 5, 2020. Net inventories of petroleum grew 9.7 million barrels in the report.
Commercial crude oil stocks accounted for much of that gain, adding 5.7 million barrels to supply. Gulf Coast facilities increased their stocks by 6.9 million barrels, offset in part by a decline of 2.3 million barrels at PAD District II’s Cushing OK storage tanks.
Currently record-high crude oil storage is likely to diminish as 2020 advances. EIA expects resurgent demand to eat into supplies beginning in June reflecting additional declines in global production and recovering demand.
Product markets did not sustain their recent growth. ULSD, for one, reached a high of $1.1824 after the EIA report. Prices fell to $1.1014 as the week of June 12 ended. Next support for ULSD is around $1.0275.
RBOB lost even more ground, losing twelve cents and winding up at $1.1243. Price support is $1.0795.
The EIA “expects that high inventory levels and ample spare crude oil production capacity will limit upward price pressures in the coming months, but as inventories decline into 2021, those upward price pressures will increase.”
None of this directly implicates Covid-19 and its influence on demand, but the bearish effect remains a significant and largely unknowable impact on the economy and on oil prices. Buyers of petroleum products can find good reasons in the data to be buyers, but the effects of Covid-19 could be severely negative through the rest of 2020. Owners of inventory should consider the use of puts to blunt the bearish impact of a return to sheltering-in-place.
Supply/Demand Balances
Supply/demand data in the United States for the week ending June 5, 2020, were released by the Energy Information Administration.
Total commercial stocks of petroleum rose by 9.7 million barrels during the week ending June 5, 2020.
Commercial crude oil supplies in the United States increased by 5.7 million barrels from the previous report week to 538.1 million barrels.
Crude oil inventory changes by PAD District:
PADD 1: Down 0.4 million barrels to 12.5 million barrels
PADD 2: Down 1.1 million barrels to 140.7 million barrels
PADD 3: Plus 6.9 million barrels to 303.7 million barrels
PADD 4: Plus 0.2 from the previous report week to 24.7 million barrels
PADD 5: Plus 0.1 million barrels to 56.4 million barrels
Cushing, Oklahoma inventories were down 2.3 million barrels from the previous report week to 49.4 million barrels.
Domestic crude oil production fell 0.1 million barrels per day from the previous report week to 11.1 million barrels daily.
Crude oil imports averaged 6.864 million barrels per day, a daily increase of 685,000 barrels. Exports fell 355,000 barrels daily to 2.439 million barrels per day.
Refineries used 73.1 percent of capacity, plus 1.3% from the previous report week.
Crude oil inputs to refineries increased 88,000 barrels daily; there were 12.991 million barrels per day of crude oil run to facilities. Gross inputs, which include blending stocks, rose 177,000 barrels daily to reach 13.484 million barrels daily.
Total petroleum product inventories rose 4.0 million barrels from the previous report week.
Gasoline stocks increased 0.9 million barrels daily from the previous report week; total stocks are 258.7 million barrels.
Demand for gasoline rose 352,000 barrels per day to 7.900 million barrels per day.
Total product demand increased 2.507 million barrels daily to 17.573 million barrels per day.
Distillate fuel oil stocks increased 1.6 million barrels from the previous report week; distillate stocks are at 175.8 million barrels. EIA reported national distillate demand at 3.302 million barrels per day during the report week, an increase of 584,000 barrels daily.
Propane stocks decreased 1.0 million barrels from the previous report week; propane stocks are 63.2 million barrels. The report estimated current demand at 1.263 barrels per day, an increase of 674,000 barrels daily from the previous report week.
Natural Gas
Spot natural gas futures prices are still range-bound. Injections to underground storage are bringing markets closer to record start-of-withdrawals levels at the end of October despite lower crude oil and natural gas production. The Energy Information Administration estimates a record 4,089 Bcf available at that time. “This forecast storage level would fill the Lower 48 states’ natural gas storage facilities to 87% of their design capacity of 4,693 Bcf and nearly 96% of their demonstrated peak capacity of 4,261 Bcf.”
The burgeoning supply situation is corroborated by futures price patterns and the history of lower highs that have been in place since mid-2008. Natural gas futures are trading at contango, a carry formation with bearish implications. An analysis of the 12-month strip puts support at $2.35. If broken, natural gas futures could see a 12-month strip around $2.10.
According to EIA:
The net injections into [natural gas] storage totaled 93 Bcf for the week ending June 5, compared with the five-year (2015–19) average net injections of 94 Bcf and last year’s net injections of 107 Bcf during the same week. Working natural gas stocks totaled 2,807 Bcf, which is 421 Bcf more than the five-year average and 748 Bcf more than last year at this time.
The average rate of injections into storage is 16% higher than the five-year average so far in the refill season (April through October). If the rate of injections into storage matched the five-year average of 9. Bcf/d for the remainder of the refill season, the total inventory would be 4,144 Bcf on October 31, which is 421 Bcf higher than the five-year average of 3,723 Bcf for that time of year.
Futures trading involves significant risk and is not suitable for everyone. Transactions in securities futures, commodity and index futures and options on future markets carry a high degree of risk. The amount of initial margin is small relative to the value of the futures contract, meaning that transactions are heavily “leveraged”. A relatively small market movement will have a proportionately larger impact on the funds you have deposited or will have to deposit: this may work against you as well as for you. You may sustain a total loss of initial margin funds and any additional funds deposited with the clearing firm to maintain your position. If the market moves against your position or margin levels are increased, you may be called upon to pay substantial additional funds on short notice to maintain your position. If you fail to comply with a request for additional funds within the time prescribed, your position may be liquidated at a loss and you will be liable for any resulting deficit. Past performance may not be indicative of future results. This is not an offer to invest in any investment program.
Powerhouse is a registered affiliate of Coquest, Inc.
Was this helpful? We’d like your feedback.
Please respond to [email protected]
Copyright© 2020 Powerhouse, All rights reserved.