Oil Markets Face Wide Array of Factors
- Chinese demand grows slowly, inventories build
- U.S. position as global supplier expanding
- Crude oil and product exports add to importance
- Natural gas supplies outpacing normal injection rate.
Sincerely,
Alan Levine, Chairman
Powerhouse
(202) 333-5380
The Matrix
Petroleum markets dealt with a broad array of inputs last week.
- China reported crude oil inventories of 966 million barrels, well above their five-year average. Refiners have boosted crude oil buys in anticipation of the country’s post-Covid recovery. But the pace of demand growth has been frustrated by consumption disappointments and refineries down for maintenance.
- Markets cannot shake global recession concerns. The reality is uncertain, but worry over the state of banking and government responses, inflation, the state of labor markets, or any of several other matters dominate economic thinking.
- The position of the United States as a global oil supplier is solidifying. Exports of distillate fuel oil to Europe have reached three-year highs. U.S. distillates are replacing Russian supplies sanctioned by the EU. This represents a diversion from Brazil, a long-term U.S. destination. Russia has found new outlets in the country, but America still is the major supplier to Brazil.
Spot WTI futures fell $5.00 last week, giving back nearly half of an $11.50 gain seen since May 4. Prices settled at $70.17. This was a weekly loss of $1.57 per barrel for WTI spot futures.
The crude oil week was tumultuous. Prices peaked at $75.06 on Monday, and moved lower throughout the week. The trading week opened with news of a unilateral production cut from Saudi Arabia. The 1 million bpd cut for the month of July initially lifted the crude oil market higher, but those gains were largely surrendered by the end of trading on Monday as traders assessed the output cut would be offset by overproduction from Russia. On Thursday, a rumor roiled crude oil markets. Stories circulated that the United States and Iran had agreed on relieving sanctions on crude oil exports. This could have allowed an additional two million barrels daily into global commerce. The rumor proved to be false, but the subsequent recovery was modest.
Other bearish elements weighed on trading. Crude oil production rose to 12.4 million barrels per day. This was the first time that level had been seen since April, 2020, when the Covid shut-in wreaked havoc with the economy. Output had topped at 13 million daily barrels in January of that year.
Supply/Demand Balances
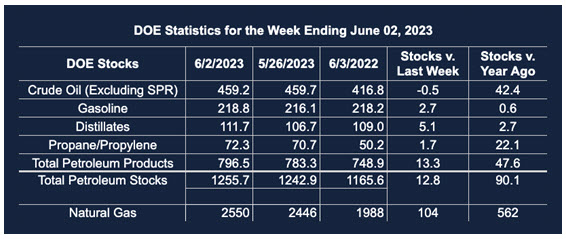
Supply/demand data in the United States for the week ended June 2, 2023, were released by the Energy Information Administration.
Total commercial stocks of petroleum rose (⬆) 12.8 million barrels to 1.2557 billion barrels during the week ended June 2, 2023.
Commercial crude oil supplies in the United States were lower (⬇) by 500,000 barrels from the previous report week to 459.2 million barrels.
Crude oil inventory changes by PAD District:
PADD 1: Down (⬇) 0.3 million barrels at 7.8 million barrels
PADD 2: Up (⬆) 2.0 million barrels to 125.2 million barrels
PADD 3: Down (⬇) 0.8 million barrels to 248.2 million barrels
PADD 4: Down (⬇) 0.6 million barrels to 26.1 million barrels
PADD 5: Down (⬇) 0.8 million barrels to 51.9 million barrels
Cushing, Oklahoma, inventories were up (⬆) 1.7 million barrels from the previous report week to 40.6 million barrels.
Domestic crude oil production was up (⬆) 200,000 barrels at 12.4 million barrels daily.
Crude oil imports averaged 6.4 million barrels per day, a daily decrease (⬇) of 817,000 barrels. Exports decreased (⬇) 2.44 million barrels daily to 2.475 million barrels per day.
Refineries used 95.8% of capacity; 2.7 percentage points higher (⬆) than the previous report week.
Crude oil inputs to refineries increased (⬆) 482,000 barrels daily; there were 16.647 million barrels per day of crude oil run to facilities. Gross inputs, which include blending stocks, increased (⬆) 495,000 barrels daily to 17.279 million barrels daily.
Total petroleum product inventories increased (⬆) by 13.3 million barrels from the previous report week, up to 796.5 million barrels.
Total product demand decreased (⬇) 221,000 barrels daily to 19.221 million barrels per day.
Gasoline stocks increased (⬆) 2.7 million barrels from the previous report week; total stocks are 218.8 million barrels.
Demand for gasoline increased (⬆) 120,000 barrels per day to 9.218 million barrels per day.
Distillate fuel oil stocks increased (⬆) 5.1 million barrels from the previous report week; distillate stocks are at 111.7 million barrels. EIA reported national distillate demand at 3.814 million barrels per day during the report week, a increased (⬆) of 168,000 barrels daily.
Propane stocks increased (⬆) by 1.7 million barrels from the previous report week to 72.3 million barrels. The report estimated current demand at 920,000 barrels per day, a increased (⬆) of 233,000 barrels daily from the previous report week.
Natural Gas
Natural gas in underground storage in the United States continues to outpace recent experience. It is early in the injection season, but storage is being filled at a rate 8% higher than over the past five years. EIA projects storage at nearly four Tcf by October, when refill ends.
The growth in storage reflects ongoing failure to generate degree days domestically. The week ended June 1, 2023, saw four fewer HDDs, and seven fewer CDDs than normal. CDDs lagged last year’s results by 16 CDDs. Notably, the Middle Atlantic states lagged last year by 21 CDDs, and the South Atlantic states by 35 CDDs.
Storage gains came despite a 7.5% increase in consumption, particularly in power generation. Electric power production grew 17.6% during the report week, while other uses fell. Residential and commercial demand fell 5.8%.
A smaller decline in industrial demand (0.3%) was consistent with continuing concerns over economic growth this year.
Supplies of natural gas rose slightly. Dry natural gas production fell 0.6%, but imports from Canada rose 18.6% during the week. Cross-border flows, disrupted because of regional wildfires, have recovered. The rally in prices has petered out, and spot futures extend their stay around $2.27.
The technical indicators, MACD and RSI, show modest divergence from price. This has not translated into an anticipated seasonal rally.
According to the EIA:
Net injections into [natural gas] storage totaled 104 Bcf for the week ended June 2, compared with the five-year (2018–2022) average net injections of 100 Bcf and last year’s net injections of 99 Bcf during the same week. Working natural gas stocks totaled 2,550 Bcf, which is 353 Bcf (16%) more than the five-year average and 562 Bcf (28%) more than last year at this time.
The average rate of injections into storage is 8% higher than the five-year average so far in the refill season (April through October). If the rate of injections into storage matched the five-year average of 9.3 Bcf/d for the remainder of the refill season, the total inventory would be 3,948 Bcf on October 31, which is 353 Bcf higher than the five-year average of 3,595 Bcf for that time of year.
Was this helpful? We’d like your feedback.
Please respond to [email protected]
Powerhouse Futures & Trading Disclaimer
Copyright 2023 Powerhouse Brokerage, LLC, All rights reserved