Big Wheels Turning
- Diesel prices have diverged from seasonal norms over the last six weeks
- U.S. manufacturing activity remains lackluster
- Recent ULSD price bounce nears technical inflection point
- Longer-term NG fundamental supply/demand changes affecting markets
Sincerely
David Thompson, CMT
Powerhouse
(202) 333-5380
The Matrix
Diesel futures typically trace out a well-defined pattern over the course of the year. A rally phase starts the year but typically stalls out in late spring. Bullish forces then regain control of the market action from mid-year through the end of autumn before a late slump in prices usually finishes off the year.
This year, front-month futures followed the pattern until April. Then, instead of building a bottom, prices continued to fall dramatically through the month of May.
Seasonal patterns are always subject to fundamental and technical influences to some degree. The U.S. manufacturing sector has weakened over the last three months. The Institute for Supply Management’s manufacturing index dropped from 50.3 in March to 48.7 in May. This weakness saps demand for diesel at a time when it is normally expected to be increasing due to construction, industrial manufacturing and freight transport.
The recent rally in front-month ULSD futures warrants scrutiny. While the fundamental statistics remain bearish, the ULSD chart did reach an oversold level last week. The ensuing mini rally is now within striking distance of reversing the month’s long downtrend in price. A decisive move above $2.50 is necessary to evidence a return of a new bull market.
Supply/Demand Balances
Supply/demand data in the United States for the week ended May 31, 2024, were released by the Energy Information Administration.
Total commercial stocks of petroleum increased (⬆) 13.5 million barrels to 1.2766 billion barrels during the week ended May 31, 2024.
Commercial crude oil supplies in the United States were higher (⬆) by 1.2 million barrels from the previous report week to 455.9 million barrels.
Crude oil inventory changes by PAD District:
PADD 1: Down (⬇) 0.8 million barrels to 8.3 million barrels
PADD 2: Down (⬇) 1.8 million barrels to 117.4 million barrels
PADD 3: Up (⬆) 2.3 million barrels to 260.6 million barrels
PADD 4: Down (⬇) 0.5 million barrels to 23.9 million barrels
PADD 5: Up (⬆) 2 million barrels to 45.8 million barrels
Cushing, Oklahoma, inventories were up (⬆) 0.9 million barrels to 35.4 million barrels.
Domestic crude oil production was unchanged (=) at 13.1 million barrels daily.
Crude oil imports averaged 7.058 million barrels per day, a daily increase (⬆) of 289,000 barrels. Exports decreased (⬇) 276,000 barrels daily to 4.5 million barrels per day.
Refineries used 95.4% of capacity; 1.1 percentage point higher (⬆) than the previous report week.
Crude oil inputs to refineries increased (⬆) 61,000 barrels daily; there were 17.144 million barrels per day of crude oil run to facilities. Gross inputs, which include blending stocks, increased (⬆) 207,000 barrels daily to 17.584 million barrels daily.
Total petroleum product inventories increased (⬆) by 12.2 million barrels from the previous report week, up to 820.7 million barrels.
Total product demand increased (⬆) 1,127,000 barrels daily to 20.51 million barrels per day.
Gasoline stocks increased (⬆) 2.1 million barrels from the previous report week; total stocks are 230.9 million barrels.
Demand for gasoline increased (⬆) 202,000 barrels per day to 8.946 million barrels per day.
Distillate fuel oil stocks increased (⬆) 3.2 million barrels from the previous report week; distillate stocks are at 122.5 million barrels. EIA reported national distillate demand at 3.367 million barrels per day during the report week, a decrease (⬇) of 428,000 barrels daily.
Propane stocks rose (⬆) 2.5 million barrels from the previous report to 68.8 million barrels. The report estimated current demand at 694,000 barrels per day, an increase (⬆) of 234,000 barrels daily from the previous report week.
Natural Gas
Front-month natural gas futures prices have reached levels not seen since the winter high watermark set in January. While the early onset of exceptionally high temperatures in both the desert Southwest and southern Florida have contributed to this price rally, some larger changes in the long-term supply & demand balance may also be playing an important role.
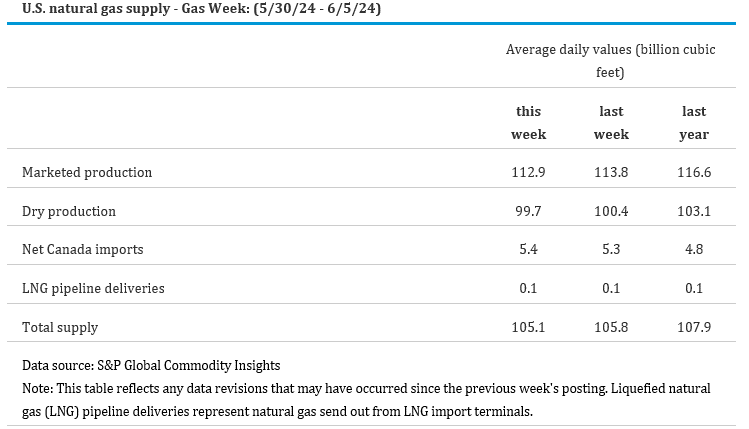
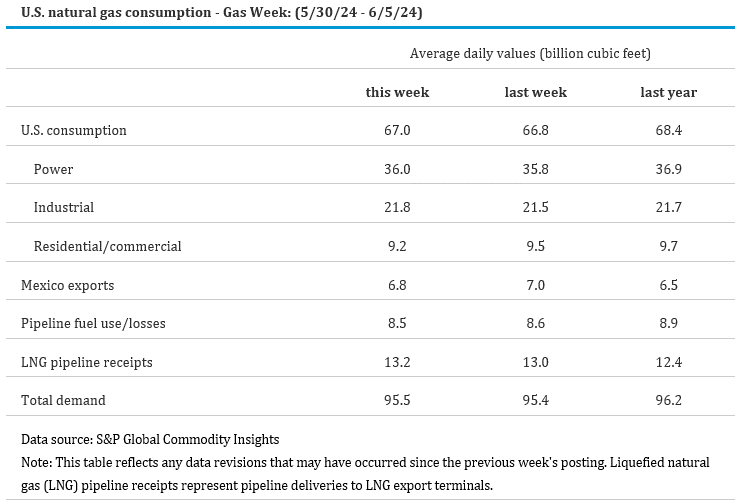
In September 2022, there were 162 rigs drilling for natural gas in the U.S. In May of this year, that number was down to just 101. Not unsurprisingly, this has led to a drop in dry gas production. As the table below shows, dry gas production has dropped by 3.30% (from 103.1 bcf/d to 99.7) year over year. While natural gas demand has also weakened, the decrease has been only 0.73% (96.2 to 95.5 bcf/d).
The hot weather has not been limited to the U.S. Record-breaking heat in parts of Asia led to a 20% y-o-y increase in LNG imports during May to meet spiking power demand.
Several analysts now see declining natural gas output in the face of strong gas combustion by power generators and increasing LNG exports leading to the elimination of the U.S. natural gas inventory surplus by the end of winter 2024/25.
According to the EIA:
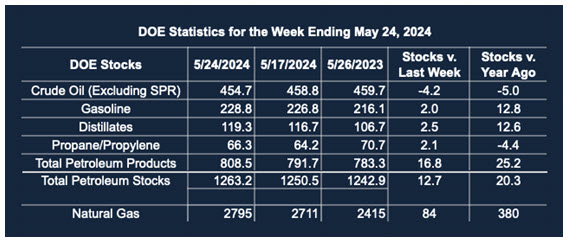
- Net injections into storage totaled 84 Bcf for the week ended May 24, compared with the five-year (2019–2023) average net injections of 104 Bcf and last year’s net injections of 106 Bcf during the same week. Working natural gas stocks totaled 2,795 Bcf, which is 586 Bcf (27%) more than the five-year average and 380 Bcf (16%) more than last year at this time.
- According to The Desk survey of natural gas analysts, estimates of the weekly net change to working natural gas stocks ranged from net injections of 71 Bcf to 86 Bcf, with a median estimate of 79 Bcf.
Was this helpful? We’d like your feedback.
Please respond to [email protected]
This material has been prepared by a sales or trading employee or agent of Powerhouse Brokers, LLC and is, or is in the nature of, a solicitation. This material is not a research report prepared by Powerhouse Brokers, LLC. By accepting this communication, you agree that you are an experienced user of the futures markets, capable of making independent trading decisions, and agree that you are not, and will not, rely solely on this communication in making trading decisions.
DISTRIBUTION IN SOME JURISDICTIONS MAY BE PROHIBITED OR RESTRICTED BY LAW. PERSONS IN POSSESSION OF THIS COMMUNICATION INDIRECTLY SHOULD INFORM THEMSELVES ABOUT AND OBSERVE ANY SUCH PROHIBITION OR RESTRICTIONS. TO THE EXTENT THAT YOU HAVE RECEIVED THIS COMMUNICATION INDIRECTLY AND SOLICITATIONS ARE PROHIBITED IN YOUR JURISDICTION WITHOUT REGISTRATION, THE MARKET COMMENTARY IN THIS COMMUNICATION SHOULD NOT BE CONSIDERED A SOLICITATION.
The risk of loss in trading futures and/or options is substantial and each investor and/or trader must consider whether this is a suitable investment. Past performance, whether actual or indicated by simulated historical tests of strategies, is not indicative of future results. Trading advice is based on information taken from trades and statistical services and other sources that Powerhouse Brokers, LLC believes are reliable. We do not guarantee that such information is accurate or complete and it should not be relied upon as such. Trading advice reflects our good faith judgment at a specific time and is subject to change without notice. There is no guarantee that the advice we give will result in profitable trades.
Copyright 2024 Powerhouse Brokers, LLC, All rights reserved