U.S. Oil Supply Balance Showing Bullish Data
- U.S. product demand recovering
- U.S. supply recovery struggling
- New drilling needs a capital infusion
- Natural gas remains range-bound

The Matrix
June opens with uncertainty for both supply and demand of oils. The DOE estimate of U.S. demand fell to 16 million barrels daily for the week ending May 22. Total domestic product demand was 13.8 million daily barrels early in April. The latest weekly data reflected a small reversal in a larger pattern of demand recovering as a function of reopening the national economy.
The same pattern showed for gasoline. The most recent report showed gasoline demand of 7.3 million barrels per day, substantially higher than the low of 5.1 million barrels daily reported for the week ending April 3.

US Crude Oil Production 1985 – 2020 source: EIA
Future crude oil availability to feed growing demand has been called into question because producers have reduced output dramatically. The United States produced 13.1 million barrels daily during the week ending March 13. Most recently, domestic output has been put at 11.4 million barrels per day. The 13% drop in supply in so short a time raises concerns for the U.S. industry’s ability to recover.
This reflects, in part, the rapid decline curve associated with shale oil wells. Replacement of existing production requires development of new wells. But drilling has not yet responded. Rig counts are making new lows. Some analysts suggest that shale oil supply could fall to less than 5 million barrels per day.
Lower production has bullish implications for price. One observer says, “less than 20% of this year’s expected drop in overall U.S. crude output will come from shuttering existing wells. … Rather, the vast majority of the supply drop will be the direct result of canceled drilling projects.”
Supply/Demand Balances
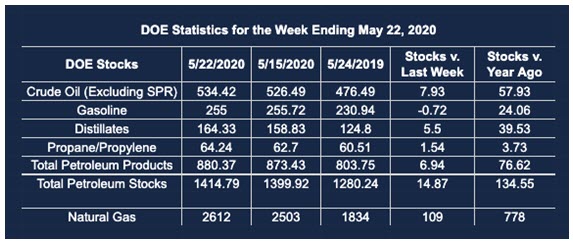
Supply/demand data in the United States for the week ending May 22, 2020, were released by the Energy Information Administration.
Total commercial stocks of petroleum rose by 14.9 million barrels during the week ending May 22, 2020.
Commercial crude oil supplies in the United States increased by 7.9 million barrels from the previous report week to 534.4 million barrels.
Crude oil inventory changes by PAD District:
PADD 1: Rose 0.3 million barrels to 12.6 million barrels
PADD 2: Down 4.0 million barrels to 143.5 million barrels
PADD 3: Plus 10.3 million barrels to 295.2 million barrels
PADD 4: Plus 0.3 from the previous report week to 25.0 million barrels
PADD 5: Plus 1.1 million barrels to 58.2 million barrels
Cushing, Oklahoma inventories were down 3.4 million barrels from the previous report week to 53.5 million barrels.
Domestic crude oil production fell 0.1 million barrels per day from the previous report week to 11.4 million barrels daily.
Crude oil imports averaged 7.200 million barrels per day, a daily increase of 2.003 million barrels. Exports fell 63,000 barrels daily to 3.176 million barrels per day.
Refineries used 71.3 percent of capacity, plus 1.9% from the previous report week.
Crude oil inputs to refineries increased 88,000 barrels daily; there were 12.991 million barrels per day of crude oil run to facilities. Gross inputs, which include blending stocks, rose 350,000 barrels daily to reach 13.527 million barrels daily.
Total petroleum product inventories rose 7.0 million barrels from the previous report week.
Gasoline stocks decreased 0.7 million barrels daily from the previous report week; total stocks are 255.0 million barrels.
Demand for gasoline rose 463,000 barrels per day to 7.253 million barrels per day.
Total product demand decreased 628,000 barrels daily to 15.958 million barrels per day.
Distillate fuel oil stocks increased 5.5 million barrels from the previous report week; distillate stocks are at 164.3 million barrels. EIA reported national distillate demand at 3.266 million barrels per day during the report week, a decrease of 402,000 barrels daily.
Propane stocks increased 1.5 million barrels from the previous report week; propane stocks are 64.2 million barrels. The report estimated current demand at 779,000 barrels per day, a decrease of 295,000 barrels daily from the previous report week.
Natural Gas
Natural gas nearby futures prices have scribed a narrow range between $1.58 and $1.97 since early in April. No appeal to degree day totals or reports of lowering production have been enough to move prices out of that range. EIA is reporting demand flat at 60.4 billion cubic feet daily. Gains from power generation were being offset by falling industrial demand. Production of natural gas fell 0.7% in the latest report. Opening the economy will eventually call for greater supply even as production remains under pressure. Breaking resistance will be an early sign of higher prices ahead.
According to EIA:
The net injections [of natural gas] into storage totaled 109 Bcf for the week ending May 22, compared with the five-year (2015–19) average net injections of 93 Bcf and last year’s net injections of 110 Bcf during the same week. Working natural gas stocks totaled 2,612 Bcf, which is 423 Bcf more than the five-year average and 778 Bcf more than last year at this time.
Futures trading involves significant risk and is not suitable for everyone. Transactions in securities futures, commodity and index futures and options on future markets carry a high degree of risk. The amount of initial margin is small relative to the value of the futures contract, meaning that transactions are heavily “leveraged”. A relatively small market movement will have a proportionately larger impact on the funds you have deposited or will have to deposit: this may work against you as well as for you. You may sustain a total loss of initial margin funds and any additional funds deposited with the clearing firm to maintain your position. If the market moves against your position or margin levels are increased, you may be called upon to pay substantial additional funds on short notice to maintain your position. If you fail to comply with a request for additional funds within the time prescribed, your position may be liquidated at a loss and you will be liable for any resulting deficit. Past performance may not be indicative of future results. This is not an offer to invest in any investment program.
Powerhouse is a registered affiliate of Coquest, Inc.
Was this helpful? We’d like your feedback.
Please respond to [email protected]
Copyright© 2020 Powerhouse, All rights reserved.