Holiday Week Does Not Slow Effect of News on Markets
- Geopolitics in Middle East grow in importance
- Available crude oil volumes fall in United States, rise globally
- Unemployment rate tops 4%
- Natural gas gains in importance as a base load fuel.
Sincerely
Al Levine, Chair
Powerhouse
(202) 333-5380

The Matrix
Weeks with a major national holiday invite slower commodity trading. Last week we observed Independence Day, and market action followed that pattern. But even slow markets are not immune to events in the broader economy and Mother Nature. Last week followed that pattern too. Geopolitical considerations have made little difference to the situation in Gaza. There are growing concerns that the front between Israel and Hezbollah may soon escalate but the Iranian election — won by a reformer—may change that dynamic.
The rapid intensification of Hurricane Beryl popped energy markets higher early in the week but those gains failed to hold as the storm weakened significantly after passing over the Yucatan peninsula. Most U.S. refineries seem to have avoided the worst case scenario. The market is now assessing how much demand may be lost as drenching rains move inland versus any possible flooding disruptions to the petroleum distribution network.
There was bearish news as well. Russian exports of crude oil are expanding. And there are signs that volumes of crude oil being held in long-term global floating storage are flowing back into the market. OPEC+ plans to expand production in the fourth quarter sparking concerns of a glut in crude oil supply. Petroleum inventories in the United States for the week ended June 28 fell 13 million barrels according to the EIA. Most of the decline came in crude oil. There was a 12.2-million-barrel decline in crude oil stocks, with small changes in product inventories.
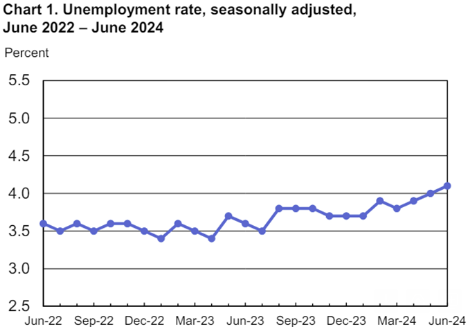
Economic data were seen as bearish. The unemployment rate rose to 4.1%, a two ½ year high. But nonfarm employment increased by 206,000 in June. These data suggest a robust economy continues. Demand for gasoline reached 9.4 million barrels daily in the week preceding the July 4th holiday. This is seasonally consistent. While year over year gasoline demand is still lagging by a few percentage points, the Department of Transportation reports a fourth straight gain in U.S. vehicle miles travelled on a year-over-year basis. This reflects the impact of new electric vehicles and improved fuel efficiency in internal combustion engines. These vehicles are expected to have a 60% growth rate through 2040.
Supply/Demand Balances
Supply/demand data in the United States for the week ended June 28, 2024, were released by the Energy Information Administration.
Total commercial stocks of petroleum decreased (⬇) 13 million barrels to 1.2831 billion barrels during the week ended June 28, 2024.
Commercial crude oil supplies in the United States were lower (⬇) by 12.2 million barrels from the previous report week to 448.5 million barrels.
Crude oil inventory changes by PAD District:
PADD 1: Unchanged at 8.1 million barrels
PADD 2: Down (⬇) 0.3 million barrels to 116.0 million barrels
PADD 3: Down (⬇) 7.2 million barrels to 257.1 million barrels
PADD 4: Down (⬇) 0.6 million barrels to 23.4 million barrels
PADD 5: Down (⬇) 4 million barrels to 43.9 million barrels
Cushing, Oklahoma, inventories were down (⬇) 0.3 million barrels to 34.2 million barrels.
Domestic crude oil production remained unchanged at 13.2 million barrels per day.
Crude oil imports averaged 6.547 million barrels per day, a daily decrease (⬇) of 64,000 barrels. Exports increased (⬆) 491,000 barrels daily to 4.401 million barrels per day.
Refineries used 93.5% of capacity; 1.3 percentage points more (⬆) than the previous report week.
Crude oil inputs to refineries increased (⬆) 260,000 barrels daily; there were 16.792 million barrels per day of crude oil run to facilities. Gross inputs, which include blending stocks, increased (⬆) 248,000 barrels daily to 17.143 million barrels daily.
Total petroleum product inventories decreased (⬇) by 0.7 million barrels from the previous report week, up to 834.6 million barrels.
Total product demand increased (⬆) 394,000 barrels daily to 21.083 million barrels per day.
Gasoline stocks decreased (⬇) 2.2 million barrels from the previous report week; total stocks are 231.7 million barrels.
Demand for gasoline increased (⬆) 455,000 barrels per day to 9.424 million barrels per day.
Distillate fuel oil stocks decreased (⬇) 1.5 million barrels from the previous report week; distillate stocks are at 119.7 million barrels. EIA reported national distillate demand at 3.715 million barrels per day during the report week, an increase (⬆) of 179,000 barrels daily.
Propane stocks rose (⬆) 2.3 million barrels from the previous report to 75.8 million barrels. The report estimated current demand at 660,000 barrels per day, a decrease (⬇) of 367,000 barrels daily from the previous report week.

The recent downturn in natural gas prices has not suggested a long-term direction for prices. In fact, the role of natural gas as a provider of energy in the United States has moved steadily higher since the beginning of the 20th century. The shift towards natural gas reflects environmentally desirable features of the fuel. This is not likely to change as the country moves toward renewable energy. Liquid petroleum was the most important source of energy through the second half of the 20th century. Its supremacy ran into trouble starting around the 1960’s.
Liquid petroleum fuels have struggled to hold their share of national energy demand. They have remained below their 2005 peak. Natural gas demand has moved steadily higher. It is now neck and neck with liquid oils. It is a matter of time before gas surpasses liquids for the most used supply source.
Renewable fuel represents a source of supply that was ignored until the beginning of this century. It has since been an intense focus of energy supplies. It provided 8.2 quadrillion Btus to energy supply in 2023. Natural gas comprised 33.6 quad Btus of energy consumption.
This leaves natural gas in a vulnerable position. Demand should grow because of environmental considerations. LNG exports are planned to grow dramatically over the decade. Overseas users are bidding for natural gas to replace coal in their energy slate. Competition among major suppliers like Australia, Dubai and the United States could trigger volatility in the price of natural gas.
According to the EIA:
- Net injections into storage totaled 52 Bcf for the week ended June 21, compared with the five-year (2019–2023) average net injections of 85 Bcf and last year’s net injections of 81 Bcf during the same week. Working natural gas stocks totaled 3,097 Bcf, which is 528 Bcf (21%) more than the five-year average and 314 Bcf (11%) more than last year at this time.
- According to The Desk survey of natural gas analysts, estimates of the weekly net change to working natural gas stocks ranged from net injections of 32 Bcf to 65 Bcf, with a median estimate of 55 Bcf.
- The average rate of injections into storage is 11% lower than the five-year average so far in the refill season (April through October). If the rate of injections into storage matched the five-year average of 8.7 Bcf/d for the remainder of the refill season, the total inventory would be 4,240 Bcf on October 31, which is 528 Bcf higher than the five-year average of 3,712 Bcf for that time of year.
Was this helpful? We’d like your feedback.
Please respond to [email protected]
This material has been prepared by a sales or trading employee or agent of Powerhouse Brokers, LLC and is, or is in the nature of, a solicitation. This material is not a research report prepared by Powerhouse Brokers, LLC. By accepting this communication, you agree that you are an experienced user of the futures markets, capable of making independent trading decisions, and agree that you are not, and will not, rely solely on this communication in making trading decisions.
DISTRIBUTION IN SOME JURISDICTIONS MAY BE PROHIBITED OR RESTRICTED BY LAW. PERSONS IN POSSESSION OF THIS COMMUNICATION INDIRECTLY SHOULD INFORM THEMSELVES ABOUT AND OBSERVE ANY SUCH PROHIBITION OR RESTRICTIONS. TO THE EXTENT THAT YOU HAVE RECEIVED THIS COMMUNICATION INDIRECTLY AND SOLICITATIONS ARE PROHIBITED IN YOUR JURISDICTION WITHOUT REGISTRATION, THE MARKET COMMENTARY IN THIS COMMUNICATION SHOULD NOT BE CONSIDERED A SOLICITATION.
The risk of loss in trading futures and/or options is substantial and each investor and/or trader must consider whether this is a suitable investment. Past performance, whether actual or indicated by simulated historical tests of strategies, is not indicative of future results. Trading advice is based on information taken from trades and statistical services and other sources that Powerhouse Brokers, LLC believes are reliable. We do not guarantee that such information is accurate or complete and it should not be relied upon as such. Trading advice reflects our good faith judgment at a specific time and is subject to change without notice. There is no guarantee that the advice we give will result in profitable trades.
Copyright 2024 Powerhouse Brokers, LLC, All rights reserved