Quiet Pre-Independence Day Trading Could Mask Traders’ Concerns
- Product futures weekly price ranges restricted
- Russian military demonstration could invite national turmoil
- Russia has found new markets for EU-sanctioned oil
- Natural gas storage volumes expand further
Sincerely,
Alan Levine, Chairman
Powerhouse
(202) 333-5380
The Matrix
The week just ended on June 30 added little to our understanding of price action. Spot futures gasoline had an inside week. An inside week is a situation where the week’s price high was lower than the week before, and the week’s low was higher than that of the prior week. Technical observers see such a situation as indecisive.
Market activity was muted. Volumes for both products were relatively light, probably reflecting the diversion of traders’ interest to the Independence Day observance ahead. Even more important could have been consideration of the implications of the week before, when Russia was embroiled in military dissension.
To be sure, Russia will continue to produce and export petroleum no matter who is in charge. The terms and conditions of that activity could change, depending on how things shake out.
Uncertain prospects for crude oil supply were heightened when Saudi Arabia announced further output cuts. The Kingdom will now produce less through August by an additional one million barrels daily. Even further monthly extensions were suggested. Russia also announced a 500,000 barrels per day cut for August.
OPEC+ has now pledged total output cuts of 5.16 million barrels per day. There has been a string of such announcements since last year when two million daily barrel cuts were agreed to. Further cuts of 1.66 million barrels were announced in April, extending to the end of 2024.
These cuts were made in response to falling demand in China and competing crude oil exports from the United States. They come despite an uncertain global economic outlook and possibly higher interest rates made in service of fighting inflation. Ironically, they have done little to provide the price boost the group has hoped for. Prices for crude oil have ranged between $65 and $85 since late last year.
Supply/Demand Balances
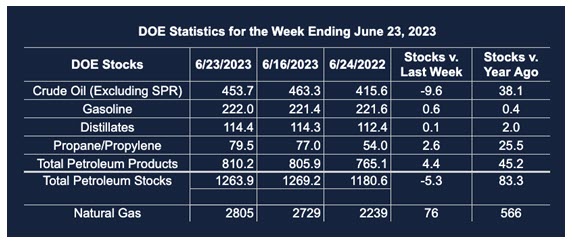
Supply/demand data in the United States for the week ended June 23, 2023, were released by the Energy Information Administration.
Total commercial stocks of petroleum fell (⬇) 5.2 million barrels to 1.2639 billion barrels during the week ended June 23, 2023
Commercial crude oil supplies in the United States were lower (⬇) by 9.6 million barrels from the previous report week to 453.7 million barrels.
Crude oil inventory changes by PAD District:
PADD 1: Down (⬇) 0.7 million barrels at 7.5 million barrels
PADD 2: Up (⬆) 0.9 million barrels to 126.8 million barrels
PADD 3: Down (⬇) 8.6 million barrels to 246.3 million barrels
PADD 4: Down (⬇) 0.3 million barrels at 25.2 million barrels
PADD 5: Down (⬇) 0.8 million barrels to 48.0 million barrels
Cushing, Oklahoma inventories were up (⬆) 1.2 million barrels from the previous report week to 43.2 million barrels.
Domestic crude oil production was unchanged (=) at 12.2 million barrels daily.
Crude oil imports averaged 6.580 million barrels per day, a daily increase (⬆) of 418,000 barrels. Exports increased (⬆) 795,000 barrels daily to 5.338 million barrels per day.
Refineries used 92.2% of capacity; 0.9 percentage points lower (⬇) than the previous report week.
Crude oil inputs to refineries decreased (⬇) 216,000 barrels daily; there were 16.254 million barrels per day of crude oil run to facilities. Gross inputs, which include blending stocks, decreased (⬇) 164,000 barrels daily to 16.847 million barrels daily.
Total petroleum product inventories increased (⬆) by 4.3 million barrels from the previous report week, up to 810.2 million barrels.
Total product demand decreased (⬇) 619,000 barrels daily to 20.306 million barrels per day.
Gasoline stocks increased (⬆) 0.6 million barrels from the previous report week; total stocks are 222.0 million barrels.
Demand for gasoline decreased (⬇) 68,000 barrels per day to 9.306 million barrels per day.
Distillate fuel oil stocks increased (⬆) 0.1 million barrels from the previous report week; distillate stocks are at 114.4 million barrels. EIA reported national distillate demand at 3.314 million barrels per day during the report week, a decrease (⬇) of 664,000 barrels daily.
Propane stocks increased (⬆) by 2.6 million barrels from the previous report week to 79.5 million barrels. The report estimated current demand at 333,000 barrels per day, a decrease (⬇) of 704,000 barrels daily from the previous report week.
Natural Gas
Spot Henry Hub natural gas prices reached a three-month high at $2.94 on Monday, last week. They subsequently fell off, with a modest rally to end the week at $2.80.
Price strength has reflected intense heat in Texas and elsewhere in the country. The number of active rigs has seen declines too. Looking forward, temps are expected to retreat from triple digits, easing cooling degrees and demand for power generation.
Overhanging natural gas storage is another drag on pricing. Builds in working natural gas inventories have been a part of the reason for relatively low natural gas prices this year, notwithstanding growing demand for LNG in global markets.
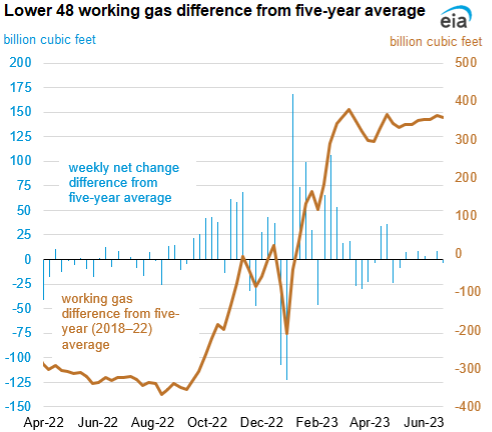
EIA developed a chart of the difference between current storage levels and the average of the past five years. A surplus of natural gas emerged early this year. Recovery from the pandemic contributed to moderate demand growth. Production, too, has increased steadily.
Storage has increased, with “working natural gas stocks at 66% of working gas capacity. Working natural gas stocks entered the 2023 refill season at a 19% (298 Bcf) surplus to the five-year average compared with a 3% (115 Bcf) deficit at the start of the 2022 refill season.” This shift of more than 400 Bcf in new availability is remarkable. The implications for price for the rest of this year are, of course, subject to many factors, including an economy steaming along at better-than-expected rates. Nonetheless, an upcoming winter demand season that could begin with 358 Bcf more than the five-year average of 3,595 Bcf, could provide a serious challenge to price bulls. (See EIA comments below.)
Price resistance can be seen at last Monday’s $2.94 high. Support can be encountered at $2.53 (from June 21.) There is a small gap below $2.34 and major price support at $1.95.
According to the EIA:
Net injections into storage totaled 76 Bcf for the week ended June 23, compared with the five-year (2018–2022) average net injections of 80 Bcf and last year’s net injections of 81 Bcf during the same week. Working natural gas stocks totaled 2,805 Bcf, which is 358 Bcf (15%) more than the five-year average and 566 Bcf (25%) more than last year at this time.
According to The Desk survey of natural gas analysts, estimates of the weekly net change to working natural gas stocks ranged from net injections of 78 Bcf to 92 Bcf, with a median estimate of 82 Bcf.
The average rate of injections into storage is 7% higher than the five-year average so far in the refill season (April through October). If the rate of injections into storage matched the five-year average of 8.8 Bcf/d for the remainder of the refill season, the total inventory would be 3,953 Bcf on October 31, which is 358 Bcf higher than the five-year average of 3,595 Bcf for that time of year.
Was this helpful? We’d like your feedback.
Please respond to [email protected]
Powerhouse Futures & Trading Disclaimer
Copyright 2023 Powerhouse Brokerage, LLC, All rights reserved