Technical Weakness Underlies Current Diesel Price Action
- Expected seasonal ULSD futures strength lacking
- Changes in futures open interest yield valuable insights
- Refiners throttle back
- Bearish natural gas sentiment dominates, but bears watching
Sincerely
David Thompson, CMT
Executive Vice President
Powerhouse
(202) 333-5380
The Matrix
POWERHOUSE has written extensively about the Spring and Fall price rallies in diesel futures prices. These seasonal patterns in refined products pricing exist primarily because of weather and refinery maintenance schedules. It is important to remember that seasonal patterns are aggregated data. Not every year will follow the average pattern precisely. Certain tools can help market participants assess what factors may distort a seasonal pattern.
POWERHOUSE closely monitors the open interest levels of futures contracts to determine if these technical readings are in sync with seasonal expectations. The strongest, most robust rallies often occur when futures open interest is rising as price rises. New participants are entering the market, and they are pushing price higher as they trade. Additionally, if bullish sentiment is still in control of a market, declines in price will likely occur on falling open interest.
This is what transpired with ULSD futures in January and February of this year, a typically bullish time of year for diesel prices. The chart below is a daily chart of ULSD futures prices with open interest levels plotted in the lower window. The dotted green box in the chart below highlights these bullish seasonal dynamics.
Contrast the green box with the dotted red box that encompasses the last two months. After a late spring pause, diesel futures prices typically show seasonal strength from mid-year through late October. But over the last two months, the rally was accompanied by a significant decline in open interest. This indicates short covering rather than an influx of new, bullish market participants. The rally was short-lived and the recent sell-off in price occurred as open interest started to increase. This is a bearish technical development and may indicate a lackluster rally into autumn.
However, markets never stand still. The bearish technical price developments are triggering fundamental actions. Market reports say U.S. refiner PBF may be planning to idle a crude processing unit at its Paulsboro, NJ refiner due to poor profit margins. And in China, not one but two 100,000 b/d refineries have been shuttered for the foreseeable future. Refinery run rates in China are now lower than during COVID according to bank analysts. If the refiners’ attempts to reduce supply are to be effective in moving prices higher, we would expect to see this rally occur as open interest also grows.
Supply/Demand Balances
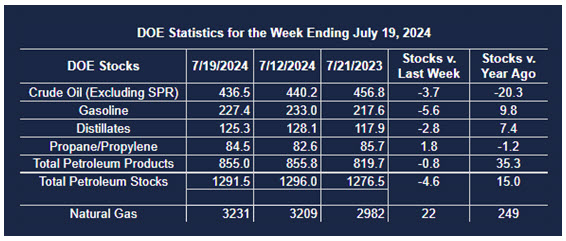
Supply/demand data in the United States for the week ended July 19, 2024, were released by the Energy Information Administration.
Total commercial stocks of petroleum decreased (⬇) 4.6 million barrels to 1.291.5 billion barrels during the week ended July 19, 2024.
Commercial crude oil supplies in the United States were lower (⬇) by 3.7 million barrels from the previous report week to 436.5 million barrels.
Crude oil inventory changes by PAD District:
PADD 1: Down (⬇) 0.7 million barrels to 7.7 million barrels
PADD 2: Down (⬇) 1.4 million barrels to 112.1 million barrels
PADD 3: Down (⬇) 1.6 million barrels to 246.9 million barrels
PADD 4: Up (⬆) 0.1 million barrels to 22.5 million barrels
PADD 5: Unchanged (=) at 47.4 million barrels
Cushing, Oklahoma, inventories were down (⬇) 1.7 million barrels to 31 million barrels.
Domestic crude oil production was unchanged (=) at 13.3 million barrels per day.
Crude oil imports averaged 6.871 million barrels per day, a daily decrease (⬇) of 166,000 barrels. Exports increased (⬆) 222,000 barrels daily to 4.186 million barrels per day.
Refineries used 91.6 percent of capacity; 2.1 percentage points less (⬇) than the previous report week.
Crude oil inputs to refineries decreased (⬇) 521,000 barrels daily; there were 16.407 million barrels per day of crude oil run to facilities. Gross inputs, which include blending stocks, decreased (⬇) 388,000 barrels daily to 16.787 million barrels daily.
Total petroleum product inventories decreased (⬇) by 0.8 million barrels from the previous report week, up to 855 million barrels.
Total product demand increased (⬆) 1,603,000 barrels daily to 21.033 million barrels per day.
Gasoline stocks decreased (⬇) 5.6 million barrels from the previous report week; total stocks are 227.4 million barrels.
Demand for gasoline increased (⬆) 673,000 barrels per day to 9.456 million barrels per day.
Distillate fuel oil stocks increased (⬆) 3.5 million barrels from the previous report week; distillate stocks are at 128.1 million barrels. EIA reported national distillate demand at 3.861 million barrels per day during the report week, an increase (⬆) of 276,000 barrels daily.
Propane stocks rose (⬆) 1.8 million barrels from the previous report to 84.5 million barrels. The report estimated current demand at 1,018,000 barrels per day, an increase (⬆) of 475,000 barrels daily from the previous report week.
Natural Gas
Freeport LNG was scheduled to return to full production on Sunday, July 28th. The facility, the second-largest LNG export plant in the U.S., pulls in over 2 billion cubic feet of natural gas per day when operating at full capacity. Markets tend to anticipate events like this one and despite the increase demand for natural gas from Freeport, the natural gas futures market has continued to move lower. This pronounced bearish reaction to clearly bullish recent development underscores the bearish sentiment in the market. The Relative Strength Index is showing the potential, yet unconfirmed, for bullish divergence. POWERHOUSE will advise if this manifests. Should bearish action continue, $1.84 is support.
According to the EIA:
- Net injections into storage totaled 22 Bcf for the week ended July 19, compared with the five-year (2019–2023) average net injections of 31 Bcf and last year’s net injections of 23 Bcf during the same week. Working natural gas stocks totaled 3,231 Bcf, which is 456 Bcf (16%) more than the five-year average and 249 Bcf (8%) more than last year at this time.
- According to The Desk survey of natural gas analysts, estimates of the weekly net change to working natural gas stocks ranged from net withdrawals of 3 Bcf to net injections of 24 Bcf, with a median estimate of net injections of 13 Bcf.
- The average rate of injections into storage is 15% lower than the five-year average so far in the refill season (April through October). If the rate of injections into storage matched the five-year average of 9 Bcf/d for the remainder of the refill season, the total inventory would be 4,168 Bcf on October 31, which is 456 Bcf higher than the five-year average of 3,712 Bcf for that time of year.
Was this helpful? We’d like your feedback.
Please respond to [email protected]
This material has been prepared by a sales or trading employee or agent of Powerhouse Brokers, LLC and is, or is in the nature of, a solicitation. This material is not a research report prepared by Powerhouse Brokers, LLC. By accepting this communication, you agree that you are an experienced user of the futures markets, capable of making independent trading decisions, and agree that you are not, and will not, rely solely on this communication in making trading decisions.
DISTRIBUTION IN SOME JURISDICTIONS MAY BE PROHIBITED OR RESTRICTED BY LAW. PERSONS IN POSSESSION OF THIS COMMUNICATION INDIRECTLY SHOULD INFORM THEMSELVES ABOUT AND OBSERVE ANY SUCH PROHIBITION OR RESTRICTIONS. TO THE EXTENT THAT YOU HAVE RECEIVED THIS COMMUNICATION INDIRECTLY AND SOLICITATIONS ARE PROHIBITED IN YOUR JURISDICTION WITHOUT REGISTRATION, THE MARKET COMMENTARY IN THIS COMMUNICATION SHOULD NOT BE CONSIDERED A SOLICITATION.
The risk of loss in trading futures and/or options is substantial and each investor and/or trader must consider whether this is a suitable investment. Past performance, whether actual or indicated by simulated historical tests of strategies, is not indicative of future results. Trading advice is based on information taken from trades and statistical services and other sources that Powerhouse Brokers, LLC believes are reliable. We do not guarantee that such information is accurate or complete and it should not be relied upon as such. Trading advice reflects our good faith judgment at a specific time and is subject to change without notice. There is no guarantee that the advice we give will result in profitable trades.
Copyright 2024 Powerhouse Brokers, LLC, All rights reserved