Prices for Petroleum Products End Week with a Rally
- Spot futures break out
- GDP estimate revised higher
- EIA expects inventories to decline
- Renewables (wind and solar) supplement natural gas for power generation; help smooth out spikes in price.
Sincerely,
Alan Levine, Chairman
Powerhouse
(202) 333-5380
The Matrix
The oil market moved to the bull side. Spot futures prices of ULSD and RBOB ended last week on a strong note. Gasoline settled at $2.8018, nearly 16 cents higher than the week before. ULSD reached $2.7457, a gain of nearly 15 cents.
The market’s bullish shift had elements internal to the oil supply/demand situation and broader economic data.
Total product demand recovered 2.1 million barrels daily during the report week ended July 14. Much of that was in distillate fuel oil, which recorded higher demand of 700,000 barrels per day. Consumption, put at 3.7 million barrels daily, was still lower than last year.
The situation for gasoline was bullish too. Inventories fell 1.1 million barrels, dropping stocks below the bottom of the five-year average level. Days of supply hugged the five-year minimum as it has been doing since February. Tight domestic supplies have not been enough to inhibit gasoline export volumes, running at more than one million barrels daily.
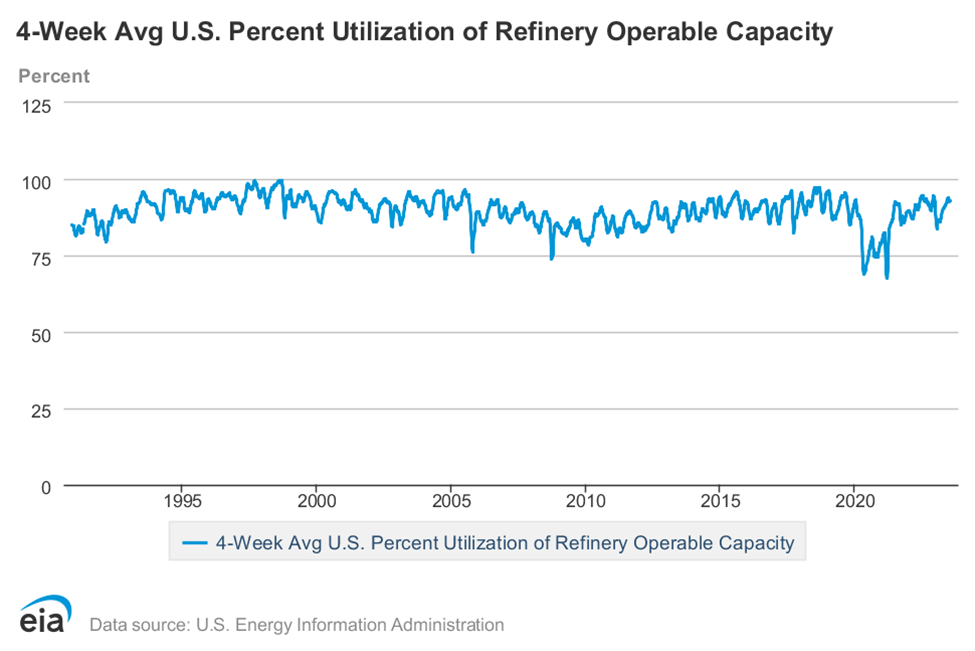
Little relief has come from refineries, where facilities ran at 94.3% of capacity in last week’s report. American refineries have been operating in excess of 90% of capacity since August 2021.
The bullish turn came because of external economic factors as well. The Energy Information Administration upped its estimates of broad economic data. Gross Domestic Product is now projected to reach growth of 1.5% in 2023, and 1.3% in 2024. Consumer spending is now higher than it was expected to be as the economy’s resilience appears following the pandemic.
Inflation may be ebbing, reflecting the work of the Federal Reserve. Some expect an additional rate hike this week of 25 basis points to 5.25%-5.50%. But, this is also expected to be the last increase in the recent spate of rate-tightening to combat inflation.
EIA also expects crude oil prices to rise. The Administration believes that inventories will diminish over the next five quarters, opening prospects for favorable investment.
One caution should be noted for those seeking a bullish entry point. Both product technical charts are strong, but both have had steady advances within the past few weeks. Technical traders know that markets advance in a wave pattern. And the advances we have seen have had little respite. The chart for ULSD in particular, is overbought, and one of the measures of overbought, the Stochastic, appears ready for a cross, suggesting a retreat.
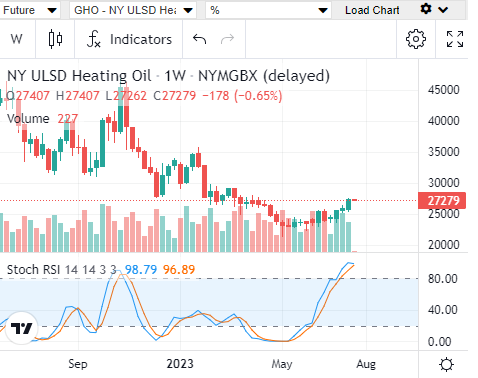
Bullish sentiment still rules, but a better entry point may soon present itself.
Supply/Demand Balances
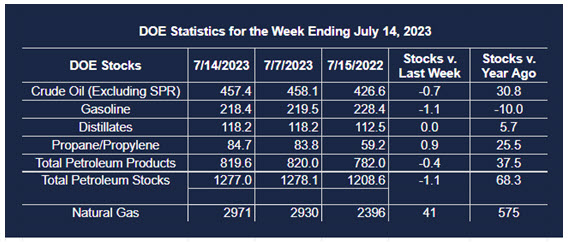
Supply/demand data in the United States for the week ended July 14, 2023, were released by the Energy Information Administration.
Total commercial stocks of petroleum fell (⬇) 1.1 million barrels to 1.2770 billion barrels during the week ended July 14, 2023.
Commercial crude oil supplies in the United States were lower (⬇) by 0.7 million barrels from the previous report week to 457.4 million barrels.
Crude oil inventory changes by PAD District:
PADD 1: Up (⬆) 0.5 million barrels to 7.9 million barrels
PADD 2: Down (⬇) 2.6 million barrels to 122.1 million barrels
PADD 3: Up (⬆) 3.9 million barrels to 256.4 million barrels
PADD 4: Down (⬇) 0.5 million barrels to 24.8 million barrels
PADD 5: Down (⬇) 2.1 million barrels to 46.2 million barrels
Cushing, Oklahoma, inventories were down (⬇) 2.9 million barrels from the previous report week to 38.3 million barrels.
Domestic crude oil production was unchanged (=) at 12.3 million barrels daily.
Crude oil imports averaged 5.880 million barrels per day, a daily decrease (⬇) of 1.158 million barrels. Exports decreased (⬇) 1.757 million barrels daily to 2.144 million barrels per day.
Refineries used 93.7% of capacity; 2.6 percentage points higher (⬆) than the previous report week.
Crude oil inputs to refineries decreased (⬇) 74,000 barrels daily; there were 16.585 million barrels per day of crude oil run to facilities. Gross inputs, which include blending stocks, increased (⬆) 101,000 barrels daily to 17.228 million barrels daily.
Total petroleum product inventories decreased (⬇) by 0.4 million barrels from the previous report week, down to 819.6 million barrels.
Total product demand increased (⬆) 2.067 million barrels daily to 20.767 million barrels per day.
Gasoline stocks decreased (⬇) 1.1 million barrels from the previous report week; total stocks are 218.4 million barrels.
Demand for gasoline increased (⬆) 99,000 barrels per day to 8.855 million barrels per day.
Distillate fuel oil stocks were unchanged (=) at 118.2 million barrels. EIA reported national distillate demand at 3.669 million barrels per day during the report week, an increase (⬆) of 700,000 barrels daily.
Propane stocks increased (⬆) by 0.9 million barrels from the previous report week to 84.7 million barrels. The report estimated current demand at 916,000 barrels per day, an increase (⬆) of 290,000 barrels daily from the previous report week.
Natural Gas
Record temperatures have been widely reported this year. This showed up in gas-fired electric power generation for the first half of the year. Output increased nearly 10% over the same period last year.
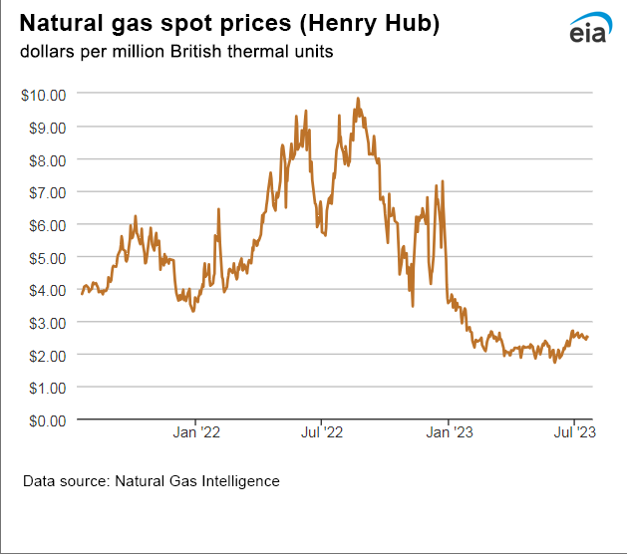
Natural gas prices have been flat despite the jump in generation. This unusual result came about because last winter’s failure to produce heating degree days resulted in a larger than normal inventory position at the end of last year’s withdrawal period.
Moreover, electricity generated from renewable sources has diverted pressure on natural-gas fired power plants, notably in Texas and California, and kept price pressures for natural gas at bay. Last week, production of power in Texas from solar sources reportedly reached a daily record, keeping the least-efficient gas-fired plants offline.
Production of power from renewables has reached a level that allows those sources to serve for peak-shaving, smoothing strains from price spikes.
Prices have been dampened also because of changes in the market situation. Last year, demand for American LNG skyrocketed. Russia’s invasion of Ukraine set retaliatory and defensive steps in motion.
The European Union imposed various limits on Russian exports to Europe. Russia sought new markets and found them in India and China. Absent Russian natural gas, buyers bid up prices for LNG from the United States. Nations of the EU have imposed stringent conservation measures, everything from dimming lights on national monuments to factory shut-ins across Europe including manufacture of steel, chemicals and automobiles.
The position of natural gas as the principal provider of fuel for power generation seems secure for now. It was the only source to show growth providing fuel for power generation compared with the first half of 2022. Nuclear power and renewables provided slightly fewer terawatts to generation, and coal lost a whopping 26 percent over the period.
According to the EIA:
- The net injections into storage totaled 41 Bcf for the week ended July 14, compared with the five-year (2018–2022) average net injections of 45 Bcf and last year’s net injections of 35 Bcf during the same week. Working natural gas stocks totaled 2,971 Bcf, which is 360 Bcf (14%) more than the five-year average and 575 Bcf (24%) more than last year at this time.
- According to The Desk survey of natural gas analysts, estimates of the weekly net change to working natural gas stocks ranged from net injections of 37 Bcf to 57 Bcf, with a median estimate of 44 Bcf.
- The average rate of injections into storage is 6% higher than the five-year average so far in the refill season (April through October). If the rate of injections into storage matched the five-year average of 9.0 Bcf/d for the remainder of the refill season, the total inventory would be 3,955 Bcf on October 31, which is 360 Bcf higher than the five-year average of 3,595 Bcf for that time of year.
Was this helpful? We’d like your feedback.
Please respond to [email protected]
Powerhouse Futures & Trading Disclaimer
Copyright 2023 Powerhouse Brokerage, LLC, All rights reserved