Trade War or Currency War?
- Trade war rhetoric continues to escalate
- Rising U.S. dollar (and interest rates) criticized by the president
- Bullish divergence in the ULSD chart
- Winter 2018-19 natural gas prices hit support.
Sincerely,
Elaine Levin, President
POWERHOUSE
(202) 333-5380

The Matrix
Volatility is returning to petroleum prices. Trade wars are bearish for commodity prices. A weaker dollar is bullish for oil, as petroleum is priced globally in U.S dollars. Last week, President Trump said in an interview that he is “ready to go” with tariffs on $500 billion of Chinese imports. He also said he does not think the Federal Reserve should continue to raise rates. The divergence in stated policy is adding to the uncertainty in the direction of the price of oil.
Tariffs are not the only weapon in a trade war. The weaker a country’s currency, the cheaper its goods are to foreign buyers. China’s currency has lost more than 8 percent over the past three months. The yuan does not float freely like many other currencies. A sell-off of this magnitude would need to be blessed by China’s central bank. Part of the impetus could be to help a slowing economy. China’s second-quarter GDP was reported at 6.7%, the slowest rate in two years. But a weaker yuan would serve a second purpose. It would provide an offset to tariffs imposed by the U.S.
The U.S. economy is strong. The Labor Department reported that the number of Americans claiming new unemployment benefits hit the lowest level since 1969. Tax cuts added stimulus to an already good economy. If the economy heats up too much, inflation becomes a worry. That is why Fed Chairman Powell reiterated last week that additional interest rate hikes are still in the cards “for now.” Trump has been trying to jawbone the Fed to change course, and on Friday tweeted, “The United States should not be penalized because we are doing so well. Tightening now hurts all that we have done. The U.S. should be allowed to recapture what was lost due to illegal currency manipulation and BAD Trade Deals.” Traders sold the U.S. dollar and bought oil. The tweet worked, at least for a day. It remains to be seen if the jawboning will have any effect on actual Fed policy.
When the fundamentals are at odds, technical analysis might allow us to get a better handle on the outlook for price. RBOB futures have held $2.00 support. The ULSD continuation charts are showing bullish divergence. Prices topped in May around $2.28. Prices sold off until mid-June, bottoming just below $2.07. After a rally, prices again moved lower in July, making a new low for the move. Technical indicators measuring the momentum of the selling did not register a new low, despite the price action. Bullish divergence can signal that the bears are running out steam and the market is getting ready to turn.
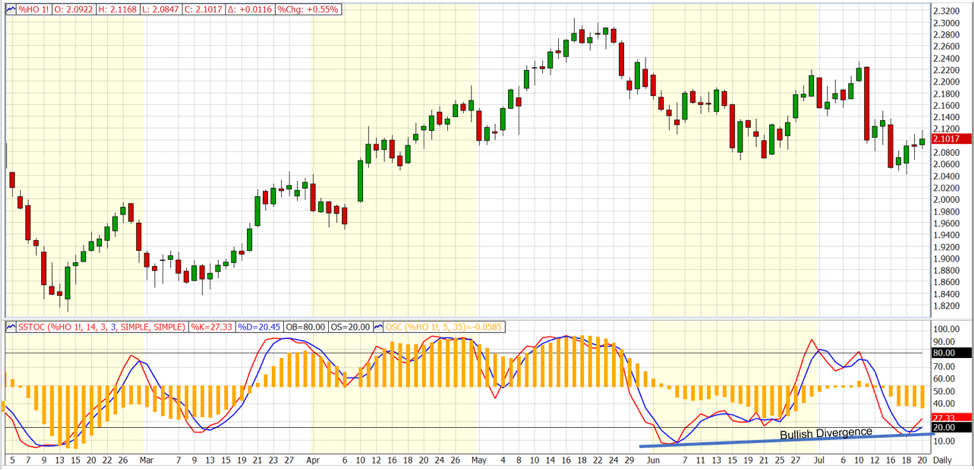
NYMEX ULSD Continuation Chart | Feb. 2018 – Jul 2018 Source: FutureSource, POWERHOUSE
Supply/Demand Balances
Supply/demand data in the United States for the week ending July 13, 2018 werereleased by the Energy Information Administration.
Total commercial stocks of petroleum rose 6.0 million barrels during the week ending July 13, 2018.
There were builds in stocks of K-jet fuel, residual fuel, propane, and other oils. Draws were reported in stocks of gasoline, fuel ethanol, and distillates.
Commercial crude oil supplies in the United States increased to 411.1 million barrels, a build of 5.8 million barrels.
Crude oil supplies increased in three of the five PAD Districts. PAD District 1 (East Coast) crude oil stocks increased 2.9 million barrels, PADD 3 (Gulf Coast) stocks rose 3.0 million barrels, and PADD 5 (West Coast) stocks grew 1.6 million barrels. PADD 2 (Midwest) stocks decreased 1.5 million barrels and PADD 4 (Rockies) stocks fell 0.2 million barrels.
Cushing, Oklahoma inventories decreased 0.8 million barrels from the previous report week to 24.9 million barrels.
Domestic crude oil production was rose 100,000 barrels per day from the previous report week to 11,000,000 million barrels per day.
Crude oil imports averaged 9.066 million barrels per day, a daily increase of 1.635 million barrels per day. Exports decreased 566,000 barrels daily to 1.461 million barrels per day.
Refineries used 94.3 per cent of capacity, a decrease of 2.4 percentage points from the previous report week.
Crude oil inputs to refineries decreased 413,000 barrels daily; there were 17.239 million barrels per day of crude oil run to facilities. Gross inputs, which include blending stocks, fell 445,000 barrels daily to 17.536 million barrels daily.
Total petroleum product inventories saw an increase of 0.2 million barrels from the previous report week.
Gasoline stocks decreased 3.2 million barrels from the previous report week; total stocks are 235.8 million barrels.
Demand for gasoline increased 433,000 barrels per day to 9.708 million barrels per day.
Total product demand increased 1.394 million barrels daily to 21.302 million barrels per day.
Distillate fuel oil stocks decreased 0.4 million barrels from the previous report week; distillate stocks are 121.3 million barrels. National distillate demand was reported at 4.141 million barrels per day during the report week. This was a weekly increase of 336,000 barrels daily.
Propane stocks rose 1.7 million barrels from the previous report week; propane stock are 65.3 million barrels. Current demand is estimated at 1.029 million barrels per day, an increase of 106,000 barrels daily from the previous report week.
Natural Gas
On June 22, the Energy Market Situation included a discussion on natural gas prices from Powerhouse’s David Thompson, CMT, “If the winter strip breaks below $3.03, I expect selling to intensify with the possibility to drive values under $2.95.” The November 2018 – March 2019 strip reached $2.868 last week. Here is David’s follow up view in a note to clients sent out this week:
The two previous, significant lows of December 2017 and May 2018 now define the next important support zone of $2.889 – $2.848. A bounce higher in price would not be out of the realm of possibility given the rapid sell-off and the accompanying blowout in volatility, however the overarching seasonal pattern still tilts bearish until September.

NYMEX NG Winter Strip |November 2018 – March 2019 Source: Thompson Reuters Eikon, POWERHOUSE
According to the Energy Information Administration:
Working gas in storage was 2,249 Bcf as of Friday, July 13, 2018, according to EIA estimates. This represents a net increase of 46 Bcf from the previous week. Stocks were 710 Bcf less than last year at this time and 535 Bcf below the five-year average of 2,784 Bcf. At 2,249 Bcf, total working gas is within the five-year historical range.
Futures trading involves significant risk and is not suitable for everyone. Transactions in securities futures, commodity and index futures and options on future markets carry a high degree of risk. The amount of initial margin is small relative to the value of the futures contract, meaning that transactions are heavily “leveraged”. A relatively small market movement will have a proportionately larger impact on the funds you have deposited or will have to deposit: this may work against you as well as for you. You may sustain a total loss of initial margin funds and any additional funds deposited with the clearing firm to maintain your position. If the market moves against your position or margin levels are increased, you may be called upon to pay substantial additional funds on short notice to maintain your position. If you fail to comply with a request for additional funds within the time prescribed, your position may be liquidated at a loss and you will be liable for any resulting deficit. Past performance may not be indicative of future results. This is not an offer to invest in any investment program.
Powerhouse is a registered affiliate of Coquest, Inc.
Was this helpful? We’d like your feedback.
Please respond to [email protected]
Copyright © 2018 Powerhouse, All rights reserved.