Inventory Builds, Demand Falters for Petroleum
- Crude oil prices make new highs
- Seventeen million barrels added to oil inventories
- Economy is strong, with some bothersome signals
- Cooling Degrees Days explode
Sincerely,
Alan Levine, Chairman
Powerhouse
(202) 333-5380
The Matrix
Spot WTI futures made new highs at $77.33 last week, settling at $75.42. This was a continuation of a rally in which prices for WTI made steady advances from a shelf of support around $67 per barrel.
Crude oils stocks built 5.9 million barrels in the week ended July 7. An additional 11.1-million-barrel increase in petroleum product stocks was recorded.
Gasoline prices settled at $2.6437 for the week. Price bulls appear to be in the driver’s seat, but the bullish side may face headwinds. Prices have carved a path higher in recent weeks, but the uptrend line supporting the advance is under threat. A move below $2.60 could shift momentum towards the bears.
Last week, demand for all petroleum products fell 2.5 million barrels daily. This is only a one-week shift, to be sure, but the general level of demand has remained static over the past several weeks. Flat demand has been met by rising inputs into refineries. Petroleum exports have taken some of the refinery output, but the increase in inventories are consistent with flat domestic demand.
Efforts to control inflation have pushed costs higher and concerns over a domestic recession are all over the financial press. The Consumer Price Index showed a drop in inflation last month, supporting the idea of a strong economy. Another economic indicator, however, suggests that a setback in economic strength may be near.
Rates for short-term lending are higher than rates for borrowing over a longer time frame. This is an “inverted yield curve.” This is counter-intuitive. Banks that lend for a shorter time are earning more than lenders for longer term debt, even though lenders for a longer time are at greater risk than those lending for less time. This is a traditional precursor to a slowdown in the economy.
Markets are always unpredictable, and that is the case here, too. The inverted yield curve has proven a reliable indicator of a recession. The contrarian in me, however, reacts to the intensity of denial of even the possibility of recession. One observer noted, “The last time the yield curve inverted was 2019. A short recession did follow, but there were some other major forces acting on the economy at the time.” Aren’t there always? “This time around, I am inclined to de-emphasize the yield curve,” said an interest rate analyst at Société Générale.
A three-percent unemployed economy is itself remarkable. Planners should, nonetheless, be aware the judgments of interest rates and what they may foretell.
Supply/Demand Balances
Supply/demand data in the United States for the week ended July 7, 2023, were released by the Energy Information Administration.
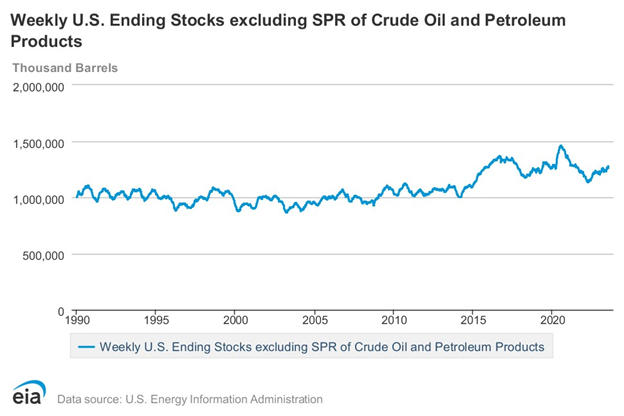
Total commercial stocks of petroleum rose (⬆) 17.0 million barrels to 1.2781 billion barrels during the week ended July 7, 2023.
Commercial crude oil supplies in the United States were higher (⬆) by 5.9 million barrels from the previous report week to 458.1 million barrels.
Crude oil inventory changes by PAD District:
PADD 1: Down (⬇) 0.5 million barrels at 7.4 million barrels
PADD 2: Down (⬇) 2.6 million barrels to 124.7 million barrels
PADD 3: Up (⬆) 8.0 million barrels to 252.5 million barrels
PADD 4: Up (⬆) 0.2 million barrels at 25.3 million barrels
PADD 5: Up (⬆) 0.9 million barrels to 48.3 million barrels
Cushing, Oklahoma, inventories were down (⬇) 1.6 million barrels from the previous report week to 41.2 million barrels.
Domestic crude oil production was down (⬇) 100,000 barrels at at 12.3 million barrels daily.
Crude oil imports averaged 5.880 million barrels per day, a daily decrease (⬇) of 1.158 million barrels. Exports decreased (⬇) 1.757 million barrels daily to 2.144 million barrels per day.
Refineries used 93.7% of capacity; 2.6 percentage points higher (⬆) than the previous report week.
Crude oil inputs to refineries increased (⬆) 629,000 barrels daily; there were 16.659 million barrels per day of crude oil run to facilities. Gross inputs, which include blending stocks, increased (⬆) 479,000 barrels daily to 17.127 million barrels daily.
Total petroleum product inventories increased (⬆) by 11.0 million barrels from the previous report week, down to 820.0 million barrels.
Total product demand decreased (⬇) 2.535 million barrels daily to 18.701 million barrels per day.
Gasoline stocks were unchanged (=) at 219.5 million barrels.
Demand for gasoline decreased (⬇) 844,000 barrels per day to 8.756 million barrels per day.
Distillate fuel oil stocks increased (⬆) 4.8 million barrels from the previous report week; distillate stocks are at 118.2 million barrels. EIA reported national distillate demand at 2.969 million barrels per day during the report week, an decreased (⬇) of 842,000 barrels daily.
Propane stocks increased (⬆) by 2.7 million barrels from the previous report week to 83.8 million barrels. The report estimated current demand at 626,000 barrels per day, a decreased (⬇) of 527,000 barrels daily from the previous report week.
Natural Gas
Cooling Degree Days exploded bringing record breaking heat to the Southwest. This was not enough to overcome the growing surplus of natural gas in storage. As noted below, working natural gas stocks totaled 14% more than the five-year average and 24% more than last year at this time.
Henry Hub spot natural gas natural gas futures ended the week at $2.54. This was only four cents lower than the prior week’s close. It was, however, the fourth consecutive week ended with lower prices. It comes also as the debate over the economy’s direction is taking a more bearish tone. For now, however, Powerhouse’s observation that significant support can be found around $2.00 remains intact.
Longer term expectations for natural gas growth can be found in the Energy Information Administration’s July 2023 Short Term Energy Outlook. This focuses on exports of Liquified Natural Gas (LNG.) EIA expects LNG exports to average 12.0 Bcf/d for this year, and 13.3 Bcf/d in 2024. Capacity at two new liquefaction projects, Golden Pass and Plaquemines, should make this expansion possible.
The projection considers the situation now in Europe to continue, with the European Union continuing to search for replacements for now-prohibited Russian natural gas. Asian demand is expected to grow as well. Non-U.S. LNG liquefaction capabilities should solidify the American position as well.
According to the EIA:
- Net injections into [natural gas] storage totaled 49 Bcf for the week ended July 7, compared with the five-year (2018–2022) average net injections of 55 Bcf and last year’s net injections of 59 Bcf during the same week. Working natural gas stocks totaled 2,930 Bcf, which is 364 Bcf (14%) more than the five-year average and 569 Bcf (24%) more than last year at this time.
- The average rate of injections into storage is 6% higher than the five-year average so far in the refill season (April through October). If the rate of injections into storage matched the five-year average of 8.9 Bcf/d for the remainder of the refill season, the total inventory would be 3,959 Bcf on October 31, which is 364 Bcf higher than the five-year average of 3,595 Bcf for that time of year.
Was this helpful? We’d like your feedback.
Please respond to [email protected]
Powerhouse Futures & Trading Disclaimer
Copyright 2023 Powerhouse Brokerage, LLC, All rights reserved