Sanctions Grab Headlines, but Oil Remains Fungible
- U.S. imposes more sanctions on Russian oil sector
- Jump in prices accompanied by shifts in buying
- OPEC spare capacity still overhangs the market
- Significant price reversal in natural gas futures bears watching
Sincerely,
David Thompson, CMT
Executive Vice President
Powerhouse
(202) 333-5380

The Matrix
Last Friday, the outgoing Biden Administration announced the farthest-reaching sanctions on the Russian energy sector to date. The new steps levy restrictions on more than 150 vessels in the ‘shadow fleet’ that transports Russian crude oil. In addition, two large Russian companies that produced a combine 2.1 million barrels/day of crude were also sanctioned.
After an initial rally in price, the energy markets are now digesting the potential effectiveness of this new round of sanctions. It is important to remember that the sanctions’ political aim of reducing Russian income from oil sales may have unintended consequences for the price of oil.
On the domestic political front, the sanctions were authorized under existing legislation, which means that a reversal will have to come through Congress as opposed to a simple executive order from the White House. With thin Republican majorities in Congress, this is not a sure thing.
Chinese and Indian buyers of Russian crude have already turned to other sources of sanction-free supply. Russia, however, may choose to lower their selling price and regain this volume. While the number of vessels now under sanction is significant, the size of the Russian shadow fleet has been estimated at over 600 ships.
OPEC has continued withholding oil supply from the market. Should this round of sanctions effectively take hundreds of thousands of barrels per day of oil off the market, this might allow the cartel to feel comfortable bringing more of its shut-in supply back to the market.
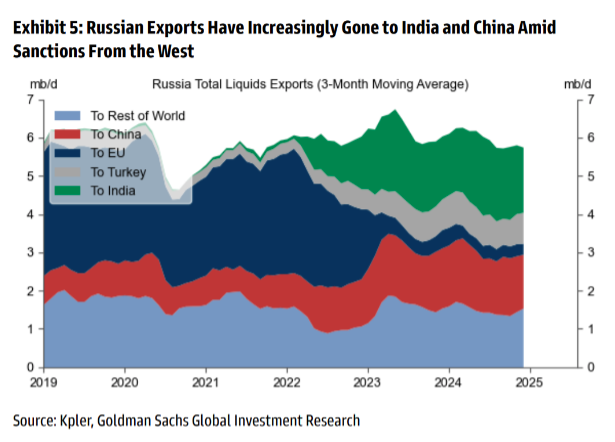
In large, oil-consuming countries, the political imperative to keep energy prices low has proven to be a powerful policy driver. The chart below shows the shifting consumption patters for Russian oil exports. The collective view from analysts is that while bullish in the short term, the long-term impact of the sanctions is limited.
Longer term, POWERHOUSE recommends market participants remain focused more on Chinese and Indian demand than on Russian supply.
Supply/Demand Balances
Supply/demand data in the United States for the week ended January 3, 2025, were released by the Energy Information Administration.
Total commercial stocks of petroleum increased (⬆) 5.0 million barrels to 1.2348 billion barrels during the week ended January 3rd, 2025.
Commercial crude oil supplies in the United States were lower (⬇) by 1.0 million barrels from the previous report week to 414.6 million barrels.
Crude oil inventory changes by PAD District:
PADD 1: Down (⬇) 0.5 million barrels to 7.8 million barrels
PADD 2: Down (⬇) 1.9 million barrels to 103.2 million barrels
PADD 3: Up (⬆) 4.9 million barrels to 232.4 million barrels
PADD 4: Unchanged (=) at 24.4 million barrels
PADD 5: Down (⬇) 3.5 million barrels to 46.8 million barrels
Cushing, Oklahoma, inventories were down (⬇) 2.5 million barrels to 20.0 million barrels.
Domestic crude oil production decreased (⬇) 10,000 barrels per day from the previous report at 13.563 million barrels per day.
Crude oil imports averaged 6.428 million barrels per day, a daily decrease (⬇) of 497,000 barrels. Exports decreased (⬇) 776,000 barrels daily to 3.078 million barrels per day.
Refineries used 93.3% of capacity; an increase (⬆) of 0.6% from the previous report week.
Crude oil inputs to refineries increased (⬆) 44,000 barrels daily; there were 16.902 million barrels per day of crude oil run to facilities. Gross inputs, which include blending stocks, increased (⬆) 96,000 barrels daily to 17.089 million barrels daily.
Total petroleum product inventories increased (⬆) by 5.9 million barrels from the previous report week, up to 820.1 million barrels.
Total product demand increased (⬆) 1,247,000 barrels daily to 19.791 million barrels per day.
Gasoline stocks increased (⬆) 6.3 million barrels from the previous report week; total stocks are 237.7 million barrels.
Demand for gasoline increased (⬆) 313,000 barrels per day to 8.481 million barrels per day.
Distillate fuel oil stocks increased (⬆) 6.1 million barrels from the previous report week; distillate stocks are at 128.9 million barrels. EIA reported national distillate demand at 3.178 million barrels per day during the report week, a decrease (⬇) of 54,000 barrels daily.
Propane stocks fell (⬇) 2.5 million barrels from the previous report to 82.6 million barrels. The report estimated current demand at 1,436,000 barrels per day, an increase (⬆) of 607,000 barrels daily from the previous report week.
Natural Gas
The front-month natural gas contract has shown a dramatic price reversal from the start of the day’s trading session at $4.347. As of writing, the decline is over 45 cents per mmbtu. A significant bloc of below average temperatures over large swaths of the country over the next 6-10 days would seem supportive of the massive jump in prices that accompanied the Sunday night opening of trading. However, markets are forward-looking and traders with bullish positions should be cautious during this time of year because only once in the last ten winters has the last price in February been higher than the last price in the month of January.
According to the EIA:
- Net withdrawals from storage totaled 40 Bcf for the week ended January 3, compared with the five-year (2020–24) average net withdrawals of 93 Bcf and last year’s net withdrawals of 104 Bcf during the same week. Working natural gas stocks totaled 3,373 Bcf, which is 207 Bcf (7%) more than the five-year average and 3 Bcf lower than last year at this time.
- According to The Desk survey of natural gas analysts, estimates of the weekly net change to working natural gas stocks ranged from net withdrawals of 28 Bcf to 68 Bcf, with a median estimate of 38 Bcf.
- The average rate of withdrawals from storage is the same as the five-year average so far in the withdrawal season (November through March). If the rate of withdrawals from storage matched the five-year average of 15.0 Bcf/d for the remainder of the withdrawal season, the total inventory would be 2,067 Bcf on March 31, which is 207 Bcf higher than the five-year average of 1,860 Bcf for that time of year.
Was this helpful? We’d like your feedback.
Please respond to [email protected]
This material has been prepared by a sales or trading employee or agent of Powerhouse Brokers, LLC and is, or is in the nature of, a solicitation. This material is not a research report prepared by Powerhouse Brokers, LLC. By accepting this communication, you agree that you are an experienced user of the futures markets, capable of making independent trading decisions, and agree that you are not, and will not, rely solely on this communication in making trading decisions.
DISTRIBUTION IN SOME JURISDICTIONS MAY BE PROHIBITED OR RESTRICTED BY LAW. PERSONS IN POSSESSION OF THIS COMMUNICATION INDIRECTLY SHOULD INFORM THEMSELVES ABOUT AND OBSERVE ANY SUCH PROHIBITION OR RESTRICTIONS. TO THE EXTENT THAT YOU HAVE RECEIVED THIS COMMUNICATION INDIRECTLY AND SOLICITATIONS ARE PROHIBITED IN YOUR JURISDICTION WITHOUT REGISTRATION, THE MARKET COMMENTARY IN THIS COMMUNICATION SHOULD NOT BE CONSIDERED A SOLICITATION.
The risk of loss in trading futures and/or options is substantial and each investor and/or trader must consider whether this is a suitable investment. Past performance, whether actual or indicated by simulated historical tests of strategies, is not indicative of future results. Trading advice is based on information taken from trades and statistical services and other sources that Powerhouse Brokers, LLC believes are reliable. We do not guarantee that such information is accurate or complete and it should not be relied upon as such. Trading advice reflects our good faith judgment at a specific time and is subject to change without notice. There is no guarantee that the advice we give will result in profitable trades.
Copyright 2025 Powerhouse Brokers, LLC, All rights reserved