Legacy Oil Industry Arrangements in Flux
- OPEC, OPEC+ output holding to limits
- Non-OPEC producers compete for market share
- U.S. oil DUCs (Developed and uncompleted wells) potential added source of crude oil
- Asian offers growing markets for oil
- Natural gas exporting LNG to Asia

The Matrix
The well-ordered world of global petroleum has been under assault. The traditional picture of oil balances was significant crude oil from OPEC’s members and major petroleum demand from the United States. Certainly, other crude oil sources and consumption in Asia were elements in global balances, but OPEC and the U.S. were the linchpins of the oil industry.
This organization has been changing. OPEC is following a pattern of restrained production designed to support prices. The group has been successful to some degree, a departure from the past when Saudi Arabia was one of a few observing previous agreements. Most recently, both Nigeria and Iraq are adhering more closely to planned production. The United Arab Emirates decreased output as well.
The group produced 29.5 million barrels daily in December 2019. Production was 50,000 barrels daily below November’s level.
The addition of Russia and other oil producers make up an expanded OPEC+ group. The larger group has agreed to a further cut of 500,000 barrels daily, effective January 1, 2020.
For all this cooperation, foreign producers are competing with the United States, where production is approaching 13 million barrels daily. EIA expects further growth but at a reduced rate. The slower rate reflects an anticipated decline in rigs drilling for oil. At the same time, rig efficiency is improving, offsetting the reduction in the number of rigs at work.
The number of Drilled but Uncompleted Wells (DUCs) is another source of potential U.S. crude oil supply. EIA estimates that DUC counts at the end of August were 7,247 units in oil-dominant regions. The oil region DUCs peaked in May 2019.
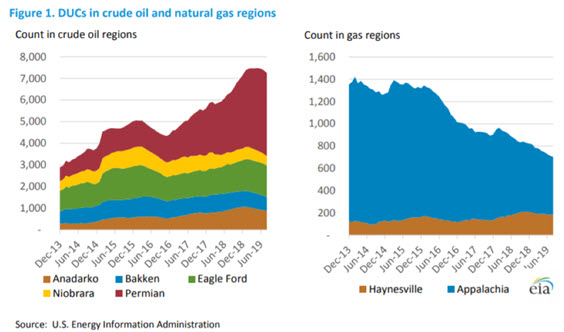
US Drilled but Uncompleted Wells 2013-2019 source: EIA
Oil consumption patterns have been shifting toward Asia. The International Energy Agency forecasts India’s demand for oil will reach six million barrels per day by 2024. India used 4.4 million barrels daily in 2017. India is becoming a key oil demand source. The country does not have significant crude oil production. India will become “even more exposed to risks of supply disruptions, geopolitical uncertainties, and the volatility of oil prices.”
Supply/Demand Balances
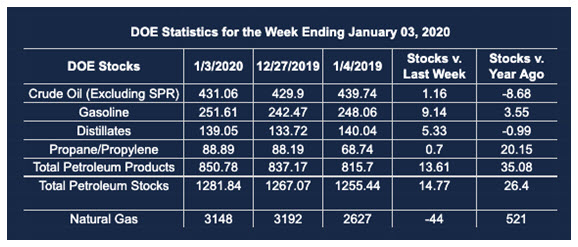
Supply/demand data in the United States for the week ending Jan. 3, 2020, were released by the Energy Information Administration.
Total commercial stocks of petroleum rose by 14.8 million barrels during the week ending Jan. 3, 2020.
Commercial crude oil supplies in the United States increased by 1.2 million barrels from the previous report week to 431.1 million barrels.
Crude oil inventory changes by PAD District:
PADD 1: Down 0.5 million barrels to 9.3 million barrels
PADD 2: Plus 0.6 million barrels to 126.5 million barrels
PADD 3: Plus 2.1 million barrels to 221.4 million barrels
PADD 4: Down 0.1 million barrels to 22.8 million barrels
PADD 5: Down 1.0 million barrels to 51.0 million barrels
Cushing, Oklahoma inventories fell 0.8 million barrels from the previous report week to 35.5 million barrels.
Domestic crude oil production was unchanged from the previous report week at 12.9 million barrels daily.
Crude oil imports averaged 6.730 million barrels per day, a daily increase of 379,000 barrels. Exports fell 1.398 million barrels daily to 3.064 million barrels per day.
Refineries used 93.0 percent of capacity, down 1.5% from the previous report week.
Crude oil inputs to refineries decreased 386,000 barrels daily; there were 16.897 million barrels per day of crude oil run to facilities. Gross inputs, which include blending stocks, fell 284,000 barrels daily to reach 17.484 million barrels daily.
Total petroleum product inventories rose 13.6 million barrels from the previous report week.
Gasoline stocks increased 9.1 million barrels daily from the previous report week; total stocks are 251.6 million barrels.
Demand for gasoline fell 828,000 barrels per day to 8.133 million barrels per day.
Total product demand decreased 571,000 barrels daily to 19.351 million barrels per day.
Distillate fuel oil stocks increased 5.3 million barrels from the previous report week; distillate stocks are at 139.1 million barrels. EIA reported national distillate demand at 3.373 million barrels per day during the report week, an increase of 318,000 barrels daily.
Propane stocks increased 0.7 million barrels from the previous report week; propane stocks are 88.9 million barrels. The report estimated current demand at 1.514 million barrels per day, an increase of 229,000 barrels daily from the previous report week.
Natural Gas
The U.S. DUC count also affects natural gas. Gas-dominant regions held 703 DUCs in mid-20109. DUCs in natural gas-dominant have generally been falling since December 2013, a potentially bullish factor.
Globalization of natural gas demand is important as U.S. supply grows. China imported 340 Tcf of LNG in December for the first time. This reflects China’s efforts to shift residential and industrial consumption away from coal.
According to EIA:
Working gas in storage was 3,148 Bcf as of Friday, January 3, 2020, according to EIA estimates. This represents a net decrease of 44 Bcf from the previous week. Stocks were 521 Bcf higher than last year at this time and 74 Bcf above the five-year average of 3,074 Bcf. At 3,148 Bcf, total working gas is within the five-year historical range.
Futures trading involves significant risk and is not suitable for everyone. Transactions in securities futures, commodity and index futures and options on future markets carry a high degree of risk. The amount of initial margin is small relative to the value of the futures contract, meaning that transactions are heavily “leveraged”. A relatively small market movement will have a proportionately larger impact on the funds you have deposited or will have to deposit: this may work against you as well as for you. You may sustain a total loss of initial margin funds and any additional funds deposited with the clearing firm to maintain your position. If the market moves against your position or margin levels are increased, you may be called upon to pay substantial additional funds on short notice to maintain your position. If you fail to comply with a request for additional funds within the time prescribed, your position may be liquidated at a loss and you will be liable for any resulting deficit. Past performance may not be indicative of future results. This is not an offer to invest in any investment program.
Powerhouse is a registered affiliate of Coquest, Inc.
Was this helpful? We’d like your feedback.
Please respond to [email protected]
Copyright© 2020 Powerhouse, All rights reserved.