Winter Weather Inhibits U.S. Product Demand
- Spot futures prices for energy fell last week
- Crude oil values nearing $70 could provide a floor price
- Strong job growth should encourage demand
- Natural gas prices for distant months could be overvalued
Sincerely,
Alan Levine, Chairman
Powerhouse
(202) 333-5380
The Matrix
Oil prices moved lower last week. ULSD spot futures ended the week at $2.775. Values have fallen nearly a dollar in less than two weeks when the high was seen at $3.58. RBOB fell from $2.70 to $2.32 in about the same time. The bullish outlook that Powerhouse and other commentators have expected has yet to materialize.
Prices are nearing support. Spot ULSD’s Friday close was, in fact, at support. A break of $2.775 could invite a new wave of selling. If support holds, buyers could be emboldened to carry prices higher.
RBOB spot futures could try $2.25 and then $2.03 for their next support level.
WTI spot futures ended the week of February 3 at $73.39. The Department of Energy has been authorized to start refilling the Strategic Petroleum Reserve should prices reach $70. This is not a mandate, but the government can be expected to be “opportunistic” in buying replacement crude oil. This could be, effectively, a floor on crude oil supplies.
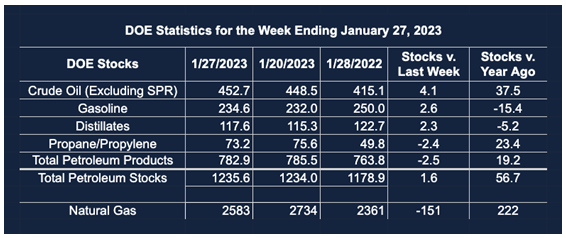
The Weekly U.S. Petroleum Balance Sheet for the week ended January 27, 2023, contained part of the reason for price weakness. The Report showed increases in inventories of commercial crude oil (+4.1 million barrels for the week.) Product stocks added too. Gasoline supplies rose 2.6 million barrels during the week, and distillate fuel oil inventories grew 2.3 million barrels during that time.

The gain in distillates was notable since traders anticipated a decline in stocks. Storms in Texas, for instance, slowed deliveries in the icy conditions. The same weather conditions inhibited use in Colorado and Ohio.
But U.S. economic conditions are showing an upside. The United States added 517,000 new jobs in January, a source of new demand for all sorts of goods and services going forward. Of course, in the perverse way of economic analysis, the good news of fuller employment could be offset by pressure on the Federal Reserve to raise interest rates to combat inflation.
The impact of various punishments on Russia have yet to be experienced. The European Union has imposed a price cap on Russian refined products, effective February 5, 2023.
Supply/Demand Balances
Supply/demand data in the United States for the week ended January 27, 2023, were released by the Energy Information Administration.
Total commercial stocks of petroleum rose (⬆) 1.6 million barrels to 1.236 billion barrels during the week ended January 27, 2023.
Commercial crude oil supplies in the United States increased (⬆) by 4.1 million barrels from the previous report week to 452.7 million barrels.
Crude oil inventory changes by PAD District:
PADD 1: Down (⬆) 1.2 million barrels to 8.5 million barrels
PADD 2: Plus (⬆) 2.8 million barrels to 123.4 million barrels
PADD 3: Plus (⬆) 0.1 million barrels to 249.0 million barrels
PADD 4: Plus (⬇) 0.1 million barrels to 25.0 million barrels
PADD 5: Down (⬆) 0.1 million barrels to 46.8 million barrels
Cushing, Oklahoma, inventories were up (⬆) 2.3 million barrels from the previous report week to 38.0 million barrels.
Domestic crude oil production was unchanged from the previous report week at 12.2 million barrels daily.
Crude oil imports averaged 7.283 million barrels per day, a daily increase (⬆) of 1,378,000 barrels. Exports decreased (⬇) 1,215,000 barrels daily to 3.492 million barrels per day.
Refineries used 85.7% of capacity; 0.4 percentage points lower (⬇) than the previous report week.
Crude oil inputs to refineries decreased (⬇) 20,000 barrels daily; there were 14.961 million barrels per day of crude oil run to facilities. Gross inputs, which include blending stocks, fell (⬇) 78,000 barrels daily to 15.439 million barrels daily.
Total petroleum product inventories fell (⬇) by 2.5 million barrels from the previous report week, rising to 782.9 million barrels.
Total product demand increased (⬆) 659,000 barrels daily to 20.106 million barrels per day.
Gasoline stocks increased (⬆) 2.6 million barrels from the previous report week; total stocks are 234.6 million barrels.
Demand for gasoline increased (⬆) 348,000 barrels per day to 8.491 million barrels per day.
Distillate fuel oil stocks increased (⬆) 2.3 million barrels from the previous report week; distillate stocks are at 117.6 million barrels. EIA reported national distillate demand at 3.692 million barrels per day during the report week, a decrease (⬇) of 186,000 barrels daily.
Propane stocks decreased (⬇) by 2.4 million barrels from the previous report week to 73.2 million barrels. The report estimated current demand at 1.482 million barrels per day, an increase (⬆) of 430,000 barrels daily from the previous report week.
Natural Gas
Record cold weather last week made headlines, but did little to reverse the decline in spot natural gas prices. Henry Hub futures prices have been moving steadily lower since just before last Christmas when they reached $7.10. The Hub ended last week at $2.41.
Prices can, of course, move lower. History suggests, however, that a price low may be near. A recent market analysis has reviewed data since the year 2000. It revealed that natural gas markets have spent 5.5% of that time below $2.50 (excluding the pandemic period.) The study puts nearby price support around $2.32 and then $2.15.
The current price chart for natural gas futures does not yet indicate a bottom in place. And some observers have not been optimistic about a strong rally in 2023. Another event like that in Ukraine, however, could cause prices to move higher. LNG export facilities are coming on line; outtakes to foreign markets should help support domestic prices this year.
According to the EIA:
The net withdrawals from storage totaled 151 Bcf for the week ended January 27, compared with the five-year (2018–2022) average net withdrawals of 181 Bcf and last year’s net withdrawals of 261 Bcf during the same week. Working natural gas stocks totaled 2,583 Bcf, which is 163 Bcf (7%) more than the five-year average and 222 Bcf (9%) more than last year at this time.
The average rate of withdrawals from storage is 22% lower than the five-year average so far in the withdrawal season (November through March). If the rate of withdrawals from storage matched the five-year average of 14.1 Bcf/d for the remainder of the withdrawal season, the total inventory would be 1,695 Bcf on March 31, which is 163 Bcf higher than the five-year average of 1,532 Bcf for that time of year.
Was this helpful? We’d like your feedback.
Please respond to [email protected]
Powerhouse Futures & Trading Disclaimer
Copyright 2023 Powerhouse Brokerage, LLC, All rights reserved