

Oil Prices Unmoved Near Term
- Crude oil inventories grow
- Russian oil shortfalls support prices
- Higher demand expected due to China’s return to global markets
- U.S. natural gas pipeline capacity growth is stunted
Sincerely,
Alan Levine, Chairman
Powerhouse
(202) 333-5380
The Matrix
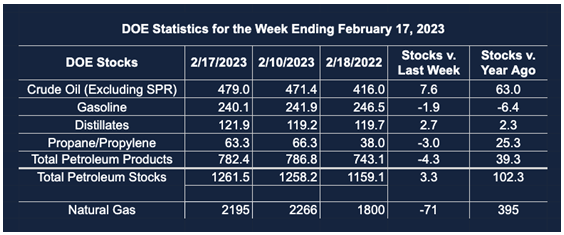
Oil prices did not move the needle last week. DOE reported an additional 7.6 million barrels in domestic commercial crude oil stocks for the week ended February 17. More than 54 million barrels of crude oil have been added to the national supply since the start of the year.
This should have been bearish, but concerns that a 25% decline in Russian oil exports could add to shortages limited the impact of the U.S. inventory news. Western allies can’t have it both ways. Export controls are intended to punish Russian aggression. One consequence, perhaps unintended, has been to support prices to the detriment of off-takers.
The fact that Russian oil still flows is due in part to the price cap imposed by the Group of Seven. This allowed oil to move, but at a discounted price. It apparently has cut into Russian revenues while allowing some exports.
The market’s reluctance to move lower may reflect an emerging bullish tone among analysts. New analysis from the financial sector highlights a revised demand growth estimate of more than one-third. China’s emergence from Covid-imposed isolation is an important part of the higher estimates. There was a 1.1 million barrels daily rise in Chinese consumption in the numbers. This could bring supply balances into deficit by mid-year.
Beyond production in the United States, (still at 12.3 million barrels daily,) downstream data reinforce America’s position in the global supply order. The country exported 10.6 million barrels of petroleum each day during the report week. Crude oil accounted for 4.6 million barrels of those outflows; products were 6.0 million barrels per day.
Distillate fuel oil exports were nearly one million barrels per day. Gasoline send-out was 900,000 daily barrels.
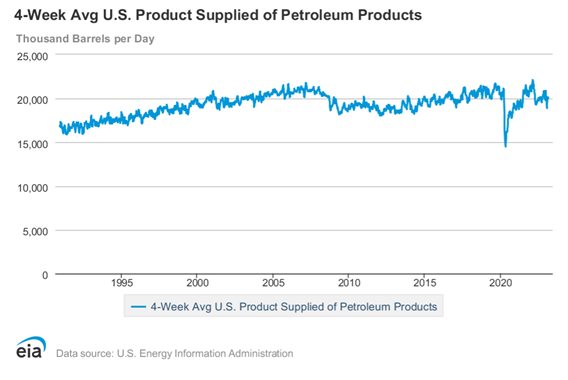
Product demand recovered, moving over 20 million barrels per day. Demand for gasoline remained near winter lows. Fewer than nine million barrels per day were supplied to markets. Consistent weekly demand numbers around 20 million barrels daily suggests a long-term upshift in demand, reflecting population growth and a generally expanding economy. Product supply averaging 18 million barrels daily used to be standard.
Supply/Demand Balances
Supply/demand data in the United States for the week ended February 17, 2023, were released by the Energy Information Administration.
Total commercial stocks of petroleum rose (⬆) 3.3 million barrels to 1.262 billion barrels during the week ended February 17, 2023.
Commercial crude oil supplies in the United States were higher (⬆) by 7.6 million barrels from the previous report week to 479.0 million barrels.
Crude oil inventory changes by PAD District:
PADD 1: Plus (⬆) 1.1 million barrels to 8.0 million barrels
PADD 2: Plus (⬆) 0.6 million barrels to 127.9 million barrels
PADD 3: Plus (⬆) 4.8 million barrels to 267.9 million barrels
PADD 4: Plus (⬆) 0.4 million barrels to 25.2 million barrels
PADD 5: Plus (⬆) 0.6 million barrels to 49.9 million barrels
Cushing, Oklahoma, inventories were up (⬆) 0.7 million barrels from the previous report week to 40.4 million barrels.
Domestic crude oil production was unchanged (=) from the previous report week at 12.3 million barrels daily.
Crude oil imports averaged 6.326 million barrels per day, a daily increase (⬆) of 94,000 barrels. Exports increased (⬆) 1.451 million barrels daily to 4.597 million barrels per day.
Refineries used 85.9% of capacity; 0.6 percentage points lower (⬇) than the previous report week.
Crude oil inputs to refineries decreased (⬇) 17,000 barrels daily; there were 15.010 million barrels per day of crude oil run to facilities. Gross inputs, which include blending stocks, fell (⬇) 106,000 barrels daily to 15.460 million barrels daily.
Total petroleum product inventories fell (⬇) by 4.3 million barrels from the previous report week, falling to 782.5 million barrels.
Total product demand increased (⬆) 916,000 barrels daily to 20.218 million barrels per day.
Gasoline stocks decreased (⬇) 1.9 million barrels from the previous report week; total stocks are 240.1 million barrels.
Demand for gasoline increased (⬆) 636,000 barrels per day to 8.910 million barrels per day.
Distillate fuel oil stocks increased (⬆) 2.7 million barrels from the previous report week; distillate stocks are at 121.9 million barrels. EIA reported national distillate demand at 3.771 million barrels per day during the report week, a decrease (⬇) of 123,000 barrels daily.
Propane stocks decreased (⬇) by 3.0 million barrels from the previous report week to 63.3 million barrels. The report estimated current demand at 1.316 million barrels per day, an increase (⬆) of 284,000 barrels daily from the previous report week.
Natural Gas
The downward trajectory of natural gas futures prices reversed last week. Henry Hub spot futures bottomed at $1.97 on Tuesday, February 25, 2023. They settled the week at $2.45. This was an impressive recovery, a nearly 25% gain in value. It was not enough to claim new high ground, falling short of nearby resistance at $2.62. A wall of resistance at $3.55 will have to be breached to consider a rally fully in force.
Expectations for a growing economy in the next year or so continue to be mixed. If expansion develops, however, natural gas prices could react strongly to distribution infrastructure shortcomings Powerhouse has discussed in the past.
EIA published an analysis of natural gas pipeline capacity additions highlighting this point. The agency said “natural gas pipeline additions between states are the lowest since 1995.”
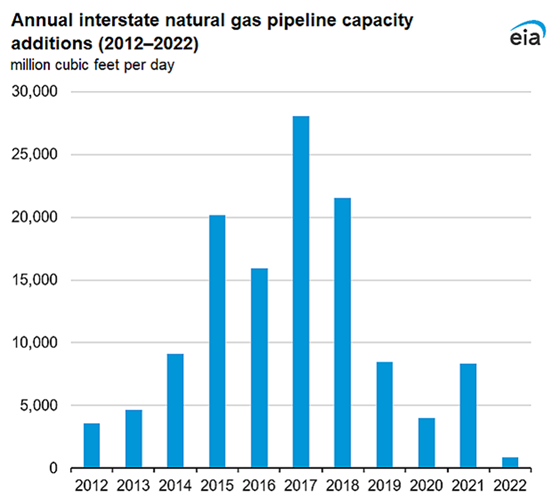
The United States added less than 900 MMcf/d of interstate natural gas pipeline capacity to the national total. This came from only five projects. The additions do not include interstate builds. More importantly they follow the pattern of lower overall capital expenditures by the industry. It is also true that much of the national increase in production has come from regions close to LNG export terminals along the Gulf Coast.
LNG exports support domestic prices. Constrained corporate infrastructure investment and the outlook for supply availability going forward have a built-in bullish price bias.
According to the EIA:
Net withdrawals from storage totaled 71 Bcf for the week ended February 17, compared with the five-year (2018–2022) average of 177 Bcf and net withdrawals of 138 Bcf during the same week a year ago. Working natural gas stocks totaled 2,195 Bcf, which is 289 Bcf (15%) more than the five-year average and 395 Bcf (22%) more than last year at this time.
The average rate of withdrawals from storage is 23% lower than the five-year average so far in the withdrawal season (November through March). If the rate of withdrawals from storage matched the five-year average of 8.9 Bcf/d for the remainder of the withdrawal season, the total inventory would be 1,821 Bcf on March 31, which is 289 Bcf higher than the five-year average of 1,532 Bcf for that time of year.
Was this helpful? We’d like your feedback.
Please respond to [email protected]
Powerhouse Futures & Trading Disclaimer
Copyright 2023 Powerhouse Brokerage, LLC, All rights reserved


