Bullish Signs Point Higher for ULSD
- Multiple bullish factors at work
- ULSD prices typically bottom in February
- New administration, new perspectives
- Natural gas supply slowed by freezes

Alan Levine—Chairman, Powerhouse
(202) 333-5380

The Matrix
Oil prices have always reacted to the physical and economic environment; 2020 (and 2021 to date) provided a little more than usual. The onset of COVID-19 virus offered the new element of a global pandemic, intensifying price changes. Optimistic expectations flowed from the development of COVID-19 vaccines.
Powerhouse has drawn attention to changes experienced in climate and their impact on demand and supply. The most recent example of a serious event was the winter storm that hit on President’s Day weekend, affecting many states’ ability to supply fuel. Electrical outages, and then loss of water and heat visited serious hits to normal living.
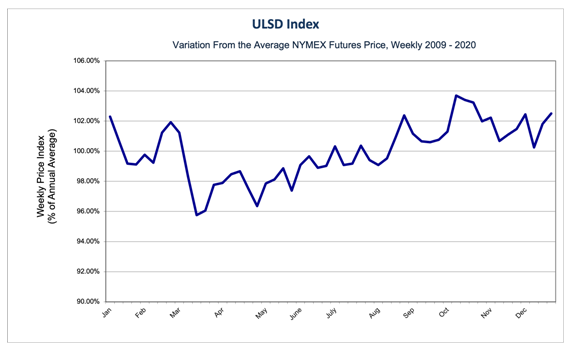
Seasonal Price Index – ULSD Based on Prices from 2009 – 2020 Source: CME, POWERHOUSE
The chart above shows the average weekly variation in ULSD prices. The low price for the year typically occurs in late February or early March. Analysis this year may be complicated by some additional factors.
Another 2020-21 change was a stark shift in the political situation. The victory of President Biden at the polls represented an about-face in the relationship of the United States and its foreign partners and adversaries. Withdrawal from global affairs, part of the Trump “America First” foreign policy is being replaced by a more accommodative set of relationships with other countries. There are important oil and natural gas implications to be evaluated.
President Biden has returned the United States to the Paris climate accord with its efforts to change the global mix of energy supplies. Another change relates to Iran. The U.S. is joining Britain, France and Germany in an effort at diplomatic engagement aimed at restoring the 2015 nuclear agreement.
Supply/Demand Balances
The Energy Information Administration released U.S. supply/demand data for the week ended February 12, 2021.
Total commercial stocks of petroleum fell by 15.1 million barrels during the week ended February 12, 2021.
Commercial crude oil supplies in the United States decreased by 7.3 million barrels from the previous report week to 461.8 million barrels.
Crude oil inventory changes by PAD District:
PADD 1: Plus 0.2 million barrels to 10.2 million barrels
PADD 2: Down 5.1 million barrels to 129.5 million barrels
PADD 3: Down 1.6 million barrels to 249.4 million barrels
PADD 4: Down 0.9 million barrels to 23.8 million barrels
PADD 5: Plus 0.3 million barrels to 48.9 million barrels
Cushing, Oklahoma, inventories were down 3.0 million barrels from the previous report week to 45.0 million barrels.
Domestic crude oil production was down 200,000 barrels per day from the previous report week to 10.8 million barrels daily.
Crude oil imports averaged 5.898 million barrels per day, a daily increase of 41,000 barrels. Exports increased 1.245 million barrels daily to 3.862 million barrels per day.
Refineries used 83.1% of capacity, up 0.1% from the previous report week.
Crude oil inputs to refineries increased 26,000 barrels daily; there were 14.819 million barrels per day of crude oil run to facilities. Gross inputs, which include blending stocks, rose 28,000 barrels daily to 15.286 million barrels daily.
Total petroleum product inventories fell 7.8 million barrels from the previous report week.
Gasoline stocks increased 0.7 million barrels daily from the previous report week; total stocks are 257.1 million barrels.
Demand for gasoline rose 549,000 barrels per day to 8.407 million barrels per day.
Total product demand increased 484,000 barrels daily to 20.668 million barrels per day.
Distillate fuel oil stocks fell 3.4 million barrels from the previous report week; distillate stocks are at 157.7 million barrels. EIA reported national distillate demand at 4.454 million barrels per day during the report week, an increase of 146,000 barrels daily.
Propane stocks decreased 2.9 million barrels from the previous report week; propane stocks are 48.6 million barrels. The report estimated current demand at 1.869 million barrels per day a decrease of 335,000 barrels daily from the previous report week.
Natural Gas
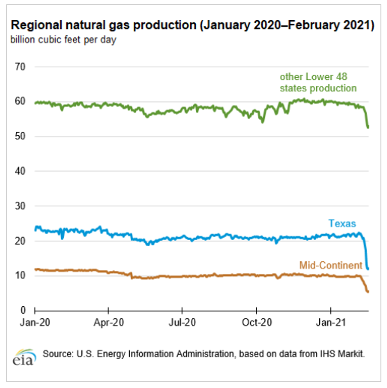
Unusually harsh winter weather has spread widely across much of the United States. Its mark has been left in sharply reduced dry natural gas production. Output of domestic natural gas fell 21.0 Bcf/d during the week ended February 12, 2021. Production stood at 69.7 Bcf/d at that time.
The decline reflected “freeze-offs,” the result of liquids collecting at the well head or in gathering lines near production activities that result in flow blockage. Texas freezes accounted for the loss of 10 Bcf/d during the report week of February 8-17.
The sharp decline of new natural gas did not affect futures prices so much. EIA’s natural gas status report was released on February 18. At the settle, spot natural gas futures were $3.041, down 14 cents from the previous close at $3.219
The April 2021 futures contract, set to be the spot contract at the close of business February 24, ended the week of February 19, 2021, at $2.98. This is below the recent April contract high of $3.06.
According to the EIA:
The net withdrawals from [natural gas] storage totaled 237 Bcf for the week ending February 12, compared with the five-year (2016–2021) average net withdrawals of 142 Bcf and last year’s net withdrawals of 141 Bcf during the same week. Working natural gas stocks totaled 2,281 Bcf, which is 57 Bcf more than the five-year average and 105 Bcf lower than last year at this time.
The average rate of withdrawals from storage is 9% higher than the five-year average so far in the withdrawal season (November through March). If the rate of withdrawals from storage matched the five-year average of 8.9 Bcf/d for the remainder of the withdrawal season, the total inventory would be 1,863 Bcf on March 31, which is 57 Bcf higher than the five-year average of 1,806 Bcf for that time of year.
Was this helpful? We’d like your feedback.
Please respond to [email protected]
Powerhouse Futures & Trading Disclaimer
Copyright 2021 Powerhouse Brokerage, LLC, All rights reserved