Diesel Prices in Carry
- Spot ULSD price fell thirty cents in last month
- Coronavirus eats into demand
- ULSD price curve in bearish carry
- Natural gas sees light support.

The Matrix
On January 8, 2020, nearby ULSD futures prices spiked to almost $2.12, following the killing of Iranian General Qassim Suleimani. And on that day, the prices of more distant futures prices of ULSD were lower. The pattern of the current price trading higher than futures prices for more distant months is called “backwardation.”
Backwardation is a bullish market indicator. Commodities like diesel fuel incur a charge for the cost of carrying inventory. (Distant futures prices are, all things being equal, more expensive because of the cost of storing the product.)
The shape of the ULSD price curve for forward months can be seen on the chart above. The chart above shows the futures market price for each month traded through January 2024.
The red line shows where prices for each future month were on January 8th.
The red line on the chart above does not follow the price carry pattern. More distant prices are cheaper notwithstanding the cost of storage in the price. Traders see the current situation as more risky and thus carrying a higher price.
The blue line shows forward prices on February 7th. Backwardation has largely disappeared from the ULSD forward price curve. Traders, anxious over the impact of events roiling global oil markets, (Libya, Venezuela, Chinese refining, Russian participation in the OPEC production cuts among other things,) have not moved prices higher.
Futures prices for current diesel fuel have lost around thirty cents in the past month. ULSD prices have moved lower despite concerns over potential global geopolitical disruption. Bearish concerns, by now well documented by futures traders, appear to have overwhelmed the bulls.
The bearish features include near-record production levels of crude oil in the United States, flagging global demand and most recently, hysteria over a coronavirus originating in Wuhan, China. Reaction to the virus has been dramatic, leading to a decline of about $8.00 to $50.52.
Reports of a possible vaccine brought the downdraft to a halt. Further ramifications of the infection are still to be experienced, but the sharp price drop in oils is likely to be over.
Oil prices are trading near major support. A break of support invites further weakness. WTI has support at $50.52 – prices are there now. Next support is at $42.35. ULSD support is around $1.6425. $1.5485 is the next level.
Oil consumption patterns have been shifting toward Asia. The International Energy Agency forecasts India’s demand for oil will reach six million barrels per day by 2024. India used 4.4 million barrels daily in 2017. India is becoming a key oil demand source. The country does not have significant crude oil production. India will become “even more exposed to risks of supply disruptions, geopolitical uncertainties, and the volatility of oil prices.”
Supply/Demand Balances
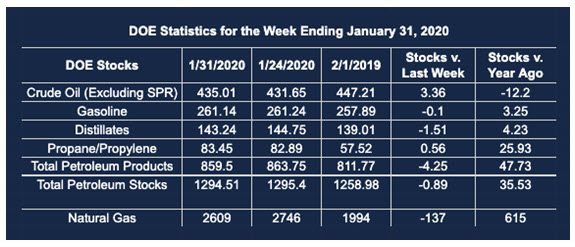
Supply/demand data in the United States for the week ending Jan. 31, 2020, were released by the Energy Information Administration.
Total commercial stocks of petroleum fell by 0.9 million barrels during the week ending Jan. 31, 2020.
Commercial crude oil supplies in the United States increased by 3.4 million barrels from the previous report week to 435.0 million barrels.
Crude oil inventory changes by PAD District:
PADD 1: Down 1.0 million barrels to 9.5 million barrels
PADD 2: Plus 1.1 million barrels to 126.9 million barrels
PADD 3: Plus 4.9 million barrels to 226.5 million barrels
PADD 4: Down 0.1 million barrels to 21.8 million barrels
PADD 5: Down 1.6 million barrels to 50.3 million barrels
Cushing, Oklahoma inventories up 1.1 million barrels from the previous report week to 36.7 million barrels.
Domestic crude oil production was fell 100,000 barrels per day from the previous report week to 12.9 million barrels daily.
Crude oil imports averaged 6.615 million barrels per day, a daily decrease of 46,000 barrels. Exports fell 96,000 barrels daily to 3.413 million barrels per day.
Refineries used 87.4 percent of capacity, up 0.2% from the previous report week.
Crude oil inputs to refineries increased 48,000 barrels daily; there were 15.972 million barrels per day of crude oil run to facilities. Gross inputs, which include blending stocks, rose 36,000 barrels daily to reach 16.445 million barrels daily.
Total petroleum product inventories fell 4.3 million barrels from the previous report week.
Gasoline stocks decreased 0.1 million barrels daily from the previous report week; total stocks are 261.1 million barrels.
Demand for gasoline rose 139,000 barrels per day to 8.933 million barrels per day.
Total product demand increased 1.197 million barrels daily to 20.835 million barrels per day.
Distillate fuel oil stocks decreased 1.5 million barrels from the previous report week; distillate stocks are at 143.2 million barrels. EIA reported national distillate demand at 4.211 million barrels per day during the report week, an increase of 309,000 barrels daily.
Propane stocks increased 0.6 million barrels from the previous report week; propane stocks are 83.4 million barrels. The report estimated current demand at 1.242 million barrels per day, a decrease of 135,000 barrels daily from the previous report week.
Natural Gas
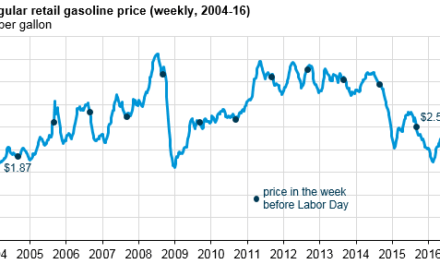
Natural gas futures traded around $1.87 as the week of February 7, 2020 closed. This price was in the middle of an $0.18 range that has persevered since January 23rd. Some colder weather could support prices, but there is nothing to suggest a significantly larger influx of Heating Degree Days.
According to EIA:
The net withdrawal from [natural gas] storage totaled 137 Bcf for the week ending January 31, compared with the five-year (2015–19) average net withdrawal of 143 Bcf and last year’s net withdrawal of 228 Bcf during the same week. Working natural gas stocks totaled 2,609 Bcf, which is 199 Bcf more than the five-year average and 615 Bcf more than last year at this time.
The average rate of withdrawal from storage is 13% lower than the five-year average so far in the withdrawal season (November through March). If the rate of withdrawal from storage matched the five-year average of 11.9 Bcf/d for the remainder of the withdrawal season, the total inventory would be 1,896 Bcf on March 31, which is 199 Bcf higher than the five-year average of 1,697 Bcf for that time of year.
Futures trading involves significant risk and is not suitable for everyone. Transactions in securities futures, commodity and index futures and options on future markets carry a high degree of risk. The amount of initial margin is small relative to the value of the futures contract, meaning that transactions are heavily “leveraged”. A relatively small market movement will have a proportionately larger impact on the funds you have deposited or will have to deposit: this may work against you as well as for you. You may sustain a total loss of initial margin funds and any additional funds deposited with the clearing firm to maintain your position. If the market moves against your position or margin levels are increased, you may be called upon to pay substantial additional funds on short notice to maintain your position. If you fail to comply with a request for additional funds within the time prescribed, your position may be liquidated at a loss and you will be liable for any resulting deficit. Past performance may not be indicative of future results. This is not an offer to invest in any investment program.
Powerhouse is a registered affiliate of Coquest, Inc.
Was this helpful? We’d like your feedback.
Please respond to [email protected]
Copyright© 2020 Powerhouse, All rights reserved.