Crude Oil Supply Balance Stabilizing?
- Commercial crude oil stocks at same level since November
- Exports showing dramatic growth
- U.S. supplies could thwart OPEC output cut plan
- Regional natural gas surpluses yielding negative prices.


The Matrix
The rate at which petroleum prices had been retreating slowed markedly on the last Friday of 2018. Generally thinner holiday-week futures market trading, indications that the supply situation in the United States may be stabilizing and the as-yet uncertain impact of closure of a large part of the U.S. federal government contributed to the pricing slow-down.
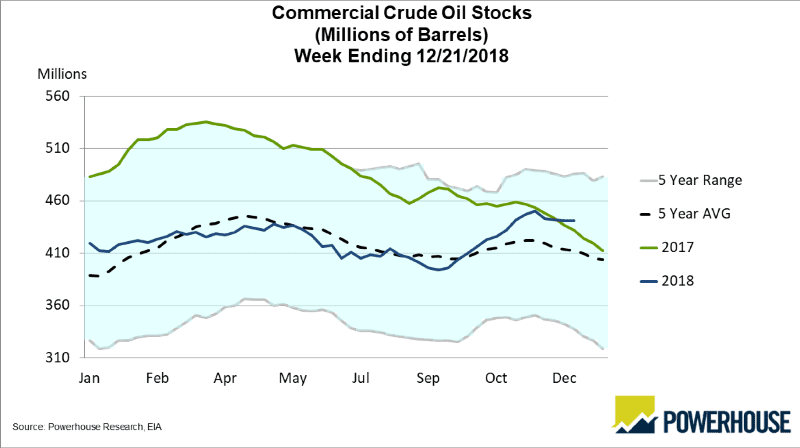
Commercial Crude Stocks 2013-2018
Source: EIA, Powerhouse
Commercial stocks of crude oil in the United States stood at 441.5 million barrels for the week ending December 21st, a level around which supplies have been holding since early November. Domestic crude oil production has leveled at 11.7 million barrels daily since early November as well.
The big supply story continues to be the explosive growth of crude oil exports. Outflows of crude oil reached nearly three million barrels daily during the report week. This was a weekly gain of seven hundred thousand barrels daily over the prior week. It sets a recent record too.

Crude Exports (4-Week Avg)1992-2018
Source: EIA
The ability of the United States petroleum industry to provide so much oil to global balances is the great unknown facing OPEC. In its efforts to support prices, Saudi Arabia has pushed a plan taking 322,000 barrels daily of crude oil off the market for six months. The kingdom has recruited Russia to join its efforts with uncertain results as well.
History is not on OPEC’s side. Close adherence to production quotas has not been a feature of previous control efforts. And the President of the United States has made no secret of his wish for lower oil prices in support of the economy.
Even with cuts from the OPEC producers, expansion of U.S. output has been inexorable. And the Energy Information Administration has now projected a gain in January, 2019 production of 134,000 barrels per day. This could bring 8.166 million barrels daily of new shale-oil to market. Such a gain would seriously impact OPEC’s efforts at price control.
Special Note:
Business planning requires data delivered on time and reliably. The Federal government is experiencing a partial shutdown. Fortunately, according to the EIA, the agency “has FY 2019 appropriations and will continue publishing and collecting data. … The Weekly Petroleum Status Report will be released on Friday, January 4, 2019 at 11:00 A.M. and 1:00 P.M. (Eastern Time) due to the closure of the Federal Government on Tuesday, January 1.”
Supply/Demand Balances
Supply/demand data in the United States for the week ending December 21, 2018 were released by the Energy Information Administration.
Total commercial stocks of petroleum decreased 2.0 million barrels during the week ending December 21, 2018.
There were draws in stocks of fuel ethanol, residual fuel, propane, and other oils. There were builds in stocks of gasoline and K-Jet fuel. Stocks of distillates were unchanged from the previous report week.
Commercial crude oil supplies in the United States was unchanged from the previous report week at 441.4 million barrels.
Crude oil supplies increased in four of the five PAD Districts. PADD 1 (East Coast) crude oil stocks grew 0.5 million barrels, PADD 2 (Midwest) stocks rose 0.4 million barrels, PADD 4 (Rockies) stocks built 0.2 million barrels, and PADD 5 (West Coast) stocks increased 1.2 million barrels. PADD 3 (Gulf Coast) stocks declined 2.5 from the previous report week.
Cushing, Oklahoma inventories increased 0.8 million barrels from the previous report week to 41.3 million barrels.
Domestic crude oil production was rose 100,000 barrels daily to 11.7 million barrels per day.
Crude oil imports averaged 7.656 million barrels per day, a daily increase of 233,000 barrels per day. Exports rose 644,000 barrels daily to 2.969 million barrels per day.
Refineries used 95.1 per cent of capacity, a decrease of 0.3 percentage points from the previous report week.
Crude oil inputs to refineries decreased 58,000 barrels daily; there were 17.350 million barrels per day of crude oil run to facilities. Gross inputs, which include blending stocks, decreased 56,000 barrels daily to 17.694 million barrels daily.
Total petroleum product inventories fell 2.0 million barrels from the previous report week.
Gasoline stocks increased 3.0 million barrels from the previous report week; total stocks are 233.1 million barrels.
Demand for gasoline increased 105,000 barrels per day to 9.348 million barrels per day.
Total product demand decreased 1.588 million barrels daily to 20.741 million barrels per day.
Distillate fuel oil stocks were unchanged from the previous report week at 119.9 million barrels. National distillate demand was reported at 4.242 million barrels per day during the report week. This was a weekly increase of 645,000 barrels daily.
Propane stocks decreased 1.0 million barrels from the previous report week; propane stock are 72.2 million barrels. Current demand is estimated at 1.137 million barrels per day, a decrease of 676,000 barrels daily from the previous report week.
Natural Gas
EIA notes:
Working gas in storage was 2,725 Bcf as of Friday, December 21, 2018, according to EIA estimates. This represents a net decrease of 48 Bcf from the previous week. Stocks were 623 Bcf less than last year at this time and 647 Bcf below the five-year average of 3,372 Bcf. At 2,725 Bcf, total working gas is below the five-year historical range.

Natural Gas Storage 2013-2018
Source: EIA
It’s ironic that natural gas in several producing areas has been priced cheaply at a time when national storage is nearly twenty per cent below recent historical levels. Prices at the West Texas Waha hub, for example, reportedly turned briefly negative. Even a subsequent price recovery has local prices less than half of the benchmark Henry Hub price. This unusual turn of events, the negative price, reflects the large amount of gas produced in association with shale oil. The large quantity of natural gas is a drag on pricing because there is insufficient infrastructure to carry the gas into regular offtake pipelines. New pipelines, planned to be available in 2019 should help reduce the glut now weighing on price. Moreover, the possibility of lower crude oil prices has already led to cuts in budgets for exploration and development, as discussed in last week’s Energy Market Situation.
Futures trading involves significant risk and is not suitable for everyone. Transactions in securities futures, commodity and index futures and options on future markets carry a high degree of risk. The amount of initial margin is small relative to the value of the futures contract, meaning that transactions are heavily “leveraged”. A relatively small market movement will have a proportionately larger impact on the funds you have deposited or will have to deposit: this may work against you as well as for you. You may sustain a total loss of initial margin funds and any additional funds deposited with the clearing firm to maintain your position. If the market moves against your position or margin levels are increased, you may be called upon to pay substantial additional funds on short notice to maintain your position. If you fail to comply with a request for additional funds within the time prescribed, your position may be liquidated at a loss and you will be liable for any resulting deficit. Past performance may not be indicative of future results. This is not an offer to invest in any investment program.
Powerhouse is a registered affiliate of Coquest, Inc.
Was this helpful? We’d like your feedback.
Please respond to [email protected]
Copyright © 2018 Powerhouse, All rights reserved.