WTI Crude Oil Prices Allow for Refill of SPR
- WTI settles at $74.29
- DOE announces plan to start refill of SPR
- Keystone pipeline shut
- Natural gas prices build a wall of resistance
Sincerely,
Alan Levine, Chairman
Powerhouse
(202) 333-5380
The Matrix
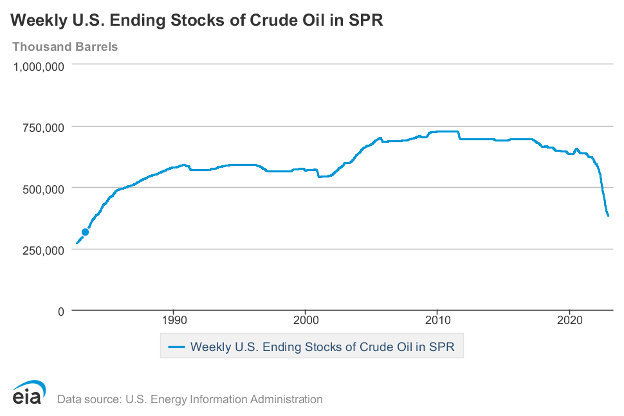
The Government issued a rule in March 2022, allowing for refill of the Strategic Petroleum Reserve (SPR). The Reserve has been depleted by 180 million barrels in an effort to lower energy costs. (SPR is at its lowest level in 38 years.) The refill price was to be around $67-$72.
In October, WTI crude oil peaked at $93.64 per barrel. West Texas Intermediate crude oil futures closed the week ended December 16 on a down note, settling at $74.29.
The Biden Administration will now seek to purchase up to three million barrels for the SPR for delivery in February 2023.
WTI crude oil prices failed to sustain a rally that had begun earlier in the month at $70.08. Demand for crude oil suffered according to the Weekly Supply/Demand Report issued by DOE. Refineries operated at 92.2% of capacity, down fully 3.3 percentage points during the Report week. This was reflected in a substantial drop in crude oil inputs to facilities – more than 65,000 barrels daily.
The decline came while the Keystone pipeline experienced a leak and was forced to curtail operations. Its shutdown took about 600,000 barrels of Canadian crude oil offline. A lengthy shutdown would of course reduce inventories at Cushing OK or at Gulf Coast refineries.

Cushing already is near lows with less than 24 million barrels in store, about one-third full. The facility has an operational low of twenty million barrels. And even after restart, Keystone would run at reduced capacity for some time.
Alternative crude oil supply and pipeline routes are available to some extent, but it takes time to implement any changes. Ironically, the SPR will provide nearly two million barrels of crude oil to offset losses on Keystone.
Supply/Demand Balances
Supply/demand data in the United States for the week ended December 9, 2022, were released by the Energy Information Administration.
Total commercial stocks of petroleum rose (⬆) 14 million barrels to 1.231 billion barrels during the week ended December 9, 2022.
Commercial crude oil supplies in the United States increased (⬆) by 10.2 million barrels from the previous report week to 424.1 million barrels.
Crude oil inventory changes by PAD District:
PADD 1: Plus (⬆) 1.3 million barrels to 8.5 million barrels
PADD 2: Unchanged (=) at 105.8 million barrels
PADD 3: Plus (⬆) 8.8 million barrels to 235.3 million barrels
PADD 4: Plus (⬆) 0.2 million barrels to 24.8 million barrels
PADD 5: Down (⬇) 0.1 million barrels to 49.7 million barrels
Cushing, Oklahoma inventories were up (⬆) 0.5 million barrels from the previous report week to 24.4 million barrels.
Domestic crude oil production was down (⬇) 100,000 barrels daily from the previous report week at 12.1 million barrels daily.
Crude oil imports averaged 6.867 million barrels per day, a daily increase (⬆) of 855,000 barrels. Exports increased (⬆) 886,000 barrels daily to 4.316 million barrels per day.
Refineries used 92.2% of capacity; 3.3 percentage points lower (⬇) than the previous report week.
Crude oil inputs to refineries decreased (⬇) 459,000 barrels daily; there were 16.126 million barrels per day of crude oil run to facilities. Gross inputs, which include blending stocks, fell (⬇) 548,000 barrels daily to 16.614 million barrels daily.
Total petroleum product inventories rose (⬆) by 3.8 million barrels from the previous report week, rising to 807.1 million barrels.
Total product demand increased (⬆) 330,000 barrels daily to 19.956 million barrels per day.
Gasoline stocks increased (⬆) 4.5 million barrels from the previous report week; total stocks are 223.6 million barrels.
Demand for gasoline decreased (⬇) 103,000 barrels per day to 8.255 million barrels per day.
Distillate fuel oil stocks increased (⬆) 1.4 million barrels from the previous report week; distillate stocks are at 120.2 million barrels. EIA reported national distillate demand at 3.768 million barrels per day during the report week, a increase (⬆) of 218,000 barrels daily.
Propane stocks increased (⬆) by 0.7 million barrels from the previous report week to 90.3 million barrels. The report estimated current demand at 1.117 million barrels per day, a decrease (⬇) of 175,000 barrels daily from the previous report week.
Natural Gas
Spot natural gas futures contracts built an imposing wall of prices last week at $7.00.
Near-term, demand through the end of the year is likely to be impacted by cold waves from Western Canada into the United States. This expectation, however, needs to be taken with caution. Some weathermen have been concerned about inconsistencies in the weather data. They think it is possible that models “could give back numerous” HDDs in future model runs.
In any case, the extent of overhead resistance developed in last week’s trading remains formidable. It could be a heavy lift to overcome before further major resistance is met at $9.13.
The supply situation for the United States and globally remains cloudy. Freeport, LA, LNG exports remain in abeyance through at least mid-first-quarter 2023. And the extent of EU demand remains unknown despite adequate levels of continental storage.
According to the EIA:
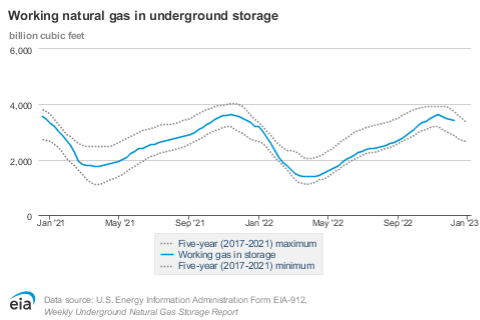
Net [natural gas] withdrawals from underground storage totaled 50 Bcf for the week ended December 9, compared with the five-year (2017–2021) average net withdrawals of 93 Bcf and last year’s net withdrawals of 83 Bcf during the same week. Working natural gas stocks totaled 3,412 Bcf, which is 15 Bcf, or less than 1%, lower than the five-year average and 18 Bcf (1%) lower than last year at this time.
Was this helpful? We’d like your feedback.
Please respond to [email protected]
Powerhouse Futures & Trading Disclaimer
Copyright 2022 Powerhouse Brokerage, LLC, All rights reserved