Crude Oil Prices Seen at $160 by 2020
- U.S. oil stocks tracking bottom of 5-year range
- Global shortfalls due to problems in Venezuela, Libya
- Crack spreads supported by strong economics
- Natural gas stocks below 5-year range for first time since 2014


The Matrix
Industry talk is all about higher crude oil prices. Expectations for 2020 are running toward $160 — and even higher.
U.S. stocks of petroleum, particularly ULSD and propane, are still tracking the bottom of the five-year inventory range. In all, the Energy Information Administration estimates total petroleum stocks (excluding SPR) at 1.2 billion barrels as the week of July 27 ended. Stocks trail last year’s level at this time by 8.3 per cent.

Distillate Fuel Oil Stocks 5-year Chart ending July 27, 2018
Source: EIA, POWERHOUSE
This shortfall is bullish for price as are the problems arising from crude oil production challenges in various countries. These nations include Libya, Venezuela, Nigeria, Iraq and Iran.
Iran is especially problematical. Plans to impose new sanctions on Iran by the United States have not caught Iran’s attention. With little inclination for Iran to negotiate, the impact on Iranian oil exports is not clear. On its face, sanctions are not likely to take more than one million barrels daily off the market.
The market is facing curtailment of oil supplies at a time when economic fundamentals seem to be strong. This can be seen in crack spread values implying attractive refinery margins. Summer gasoline cracks are trading around $18, basis September. Winter ULSD crack spreads are returning $23, basis December.
Bullish supply and bullish demand should result in higher prices. Analysts have presented an extremely wide range of price projections reflecting this idea. The least of these is a retest of $80 later in 2018. Complicating this forecast is the seasonal pattern of crude oil prices. Data from 2000 through 2017 show crude oil futures prices tend to top out in July and trend lower until December.
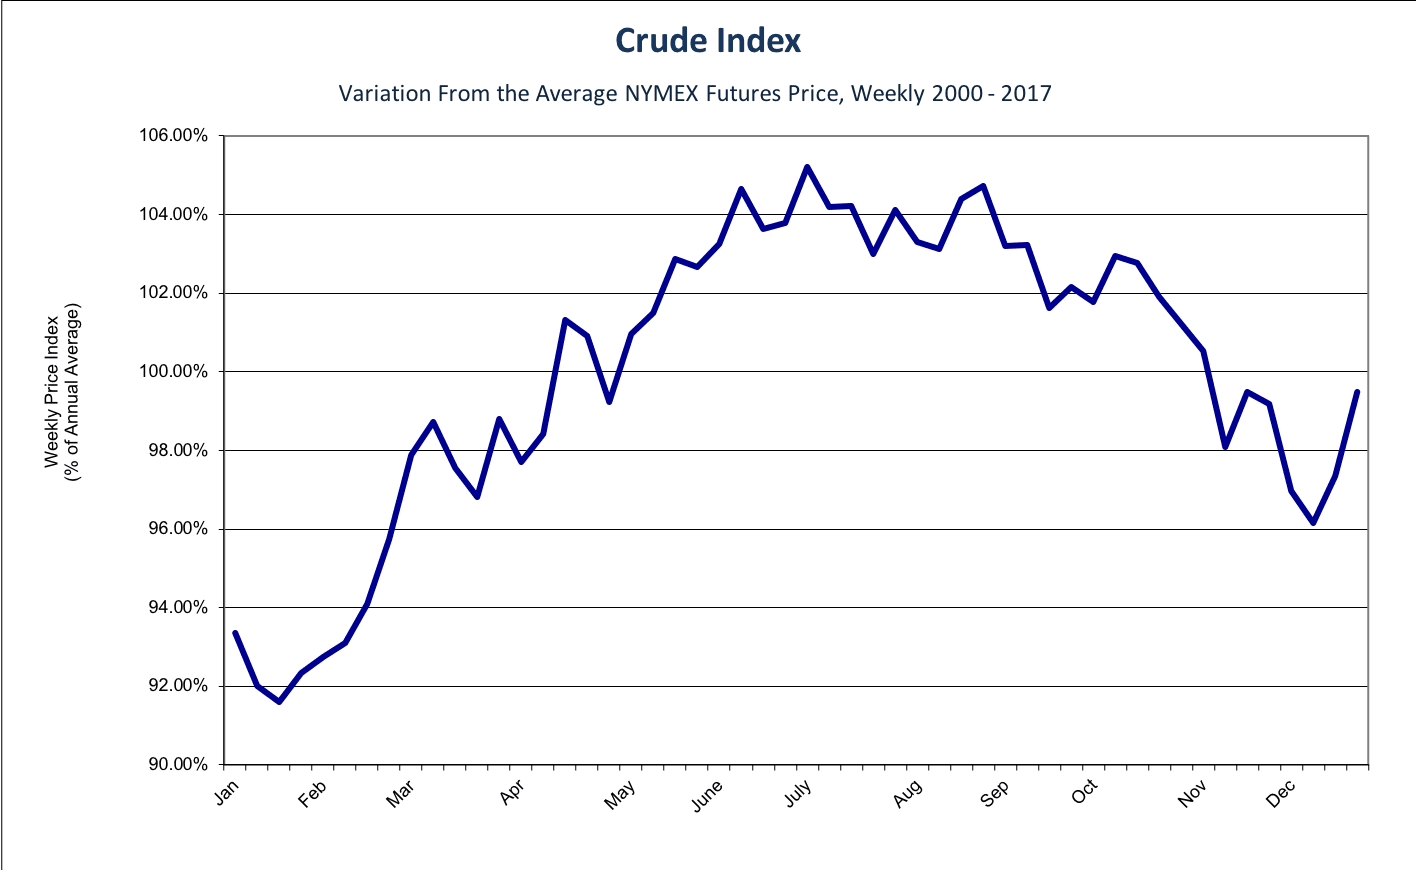
Seasonal Crude Futures Prices 18-year Chart 2000-2017 Source: CME, POWERHOUSE
A survey of more than 40 analysts averaged 2018 WTI crude oil at $67.32. This is a monthly survey that has shown higher oil prices in each of the past ten consecutive months. Over a longer time horizon, one economist suggests $160 around the time maritime use of fuels with 0.5% sulphur is mandated in 2020.
All of this bullishness has not yet appeared in price. Late in June, spot crude oil futures traded around $67.50. Subsequently they rose to $75.27 on July 3rd. This rapid spike was not sustainable, returning to $67.50 by the end of the month, reflecting anxiety over the appearance of a price-depressing trade dispute with China.
Supply/Demand Balances
Supply/demand data in the United States for the week ending July 27, 2018 were released by the Energy Information Administration.
Total commercial stocks of petroleum rose 10.6 million barrels during the week ending July 27, 2018.
There were builds in stocks of fuel ethanol, K-jet fuel, distillate fuel oil, residual fuel oil, propane, and other oils. There was a draw in stocks of gasoline.
Commercial crude oil supplies in the United States increased to 408.7 million barrels, a build of 3.8 million barrels.
Crude oil supplies decreased in four of the five PAD Districts. PAD District 1 (East Coast) crude oil stocks fell 1.0 million barrels, PADD 2 (Midwest) crude stocks declined 0.5 million barrels, and PADD 5 (West Coast) stocks retreated 0.3 million barrels. There was a build of 5.4 million barrels of crude oil stocks in PADD 3 (Gulf Coast). Crude oil stocks in PADD 4 (Rockies) were unchanged from the previous report week.
Cushing, Oklahoma inventories decreased 1.3 million barrels from the previous report week to 22.4 million barrels.
Domestic crude oil production fell 100,000 barrels per day in the last report week to 10.900 million barrels per day.
Crude oil imports averaged 7.749 million barrels per day, a daily decrease of 21,000 barrels per day. Exports decreased 1.373 million barrels daily to 1.310 million barrels per day.
Refineries used 96.1 per cent of capacity, an increase of 2.3 percentage points from the previous report week.
Crude oil inputs to refineries increased 195,000 barrels daily; there were 17.480 million barrels per day of crude oil run to facilities. Gross inputs, which include blending stocks, rose 429,000 barrels daily to 17.285 million barrels daily.
Total petroleum product inventories saw an increase of 6.8 million barrels from the previous report week.
Gasoline stocks decreased 2.5 million barrels from the previous report week; total stocks are 231.0 million barrels.
Demand for gasoline increased 32,000 barrels per day to 9.878 million barrels per day.
Total product demand decreased 1.131 million barrels daily to 20.570 million barrels per day.
Distillate fuel oil stocks increased 3.0 million barrels from the previous report week; distillate stocks are 124.2 million barrels. National distillate demand was reported at 3.611 million barrels per day during the report week. This was a weekly decrease of 557,000 barrels daily.
Propane stocks rose 1.8 million barrels from the previous report week; propane stock are 66.3 million barrels. Current demand is estimated at 558,000 million barrels per day, a decrease of 535,000 barrels daily from the previous report week.
Natural Gas
According to the Energy Information Administration:
Net injections are lower than the five-year average for the fifth week in a row. Net injections into storage totaled 35 Bcf for the week ending July 27, compared with the five-year (2013–17) average net injections of 43 Bcf and last year’s net injections of 18 Bcf during the same week. Working gas stocks totaled 2,308 Bcf, which is 565 Bcf lower than the five-year average and 688 Bcf lower than last year at this time.
Working gas stocks are below the five-year range for the first time since 2014. Net injections into storage are 19% lower than the five-year average rate so far in the 2018 refill season. If working gas stocks match the five-year average rate of injections of 9.6 Bcf/d for the remainder of the refill season, inventories will total 3,250 Bcf on October 31, 310 Bcf lower than the five-year low of 3,560 Bcf.
Futures trading involves significant risk and is not suitable for everyone. Transactions in securities futures, commodity and index futures and options on future markets carry a high degree of risk. The amount of initial margin is small relative to the value of the futures contract, meaning that transactions are heavily “leveraged”. A relatively small market movement will have a proportionately larger impact on the funds you have deposited or will have to deposit: this may work against you as well as for you. You may sustain a total loss of initial margin funds and any additional funds deposited with the clearing firm to maintain your position. If the market moves against your position or margin levels are increased, you may be called upon to pay substantial additional funds on short notice to maintain your position. If you fail to comply with a request for additional funds within the time prescribed, your position may be liquidated at a loss and you will be liable for any resulting deficit. Past performance may not be indicative of future results. This is not an offer to invest in any investment program.
Powerhouse is a registered affiliate of Coquest, Inc.
Was this helpful? We’d like your feedback.
Please respond to [email protected]
Copyright © 2018 Powerhouse, All rights reserved