
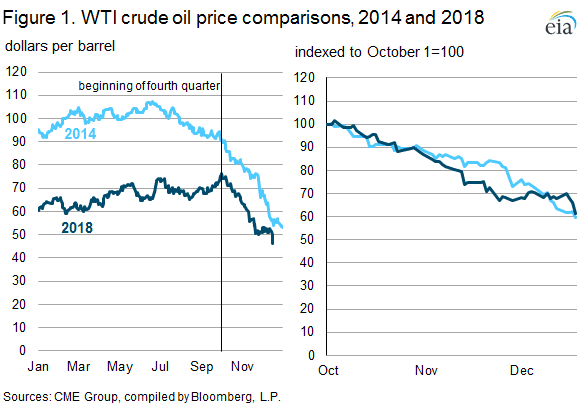
The decline in oil prices since the beginning of the fourth quarter of 2018 is of similar magnitude to the fourth-quarter price decline in 2014. After the fourth-quarter 2014 price decline, prices dropped further in 2015 amid high volatility for several years, which contributed to bankruptcies, consolidations, and closures within the industry. When comparing the financial positions of U.S. oil producers as of the third quarter of 2018 with the third quarter of 2014, most measures of profitability and balance sheet fitness indicate companies should be able to weather the recent price downturn. Oil price volatility and uncertainty remain high, however, and financial pressures could increase if prices continue to decline.
The percentage price decline from the beginning of the fourth quarter of 2018 through December 18 followed a similar path when compared with the same period starting at the fourth quarter of 2014 (Figure 1). From October 1 through December 18, front-month West Texas Intermediate (WTI) crude oil prices declined 39%. In 2014, they declined 40% during the same period. A key difference in assessing the financial position of U.S. oil producers in 2014 compared with 2018, however, is that oil price levels were significantly higher in the years leading up to the 2014 price declines compared with 2018. In addition, in 2014 oil prices had already declined 15% from their highs in June by the start of the fourth quarter. In 2018, the start of the fourth quarter marked the highest prices of the year.
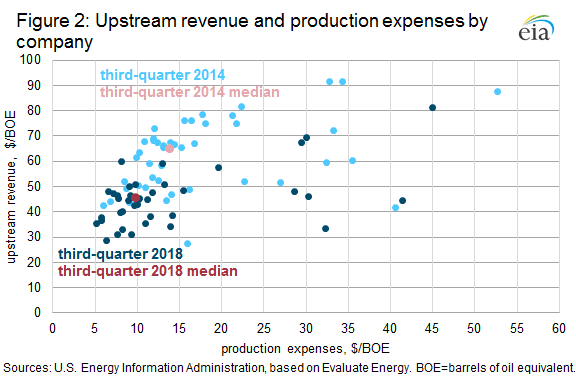
Given the different price levels, oil company revenues per barrel were significantly lower in the third quarter of 2018 compared with the third quarter of 2014. According to the third-quarter 2018 financial results of 40 U.S. oil companies, their median upstream revenue was $45.33 per barrel of oil equivalent (BOE). This same set of companies in the third quarter of 2014 had median upstream revenues of $64.57/BOE (Figure 2). The 44 companies included then have been reduced to 40 companies because of consolidation through mergers and acquisitions. Another evident difference between these two periods is that the companies have significantly reduced production expenses since 2014, ultimately contributing to higher profitability despite the decline in revenues. Median company production expenses declined from $13.97/BOE in the third quarter of 2014 to $9.87/BOE in the third quarter of 2018. In fact, the median company’s production expenses in the third quarter of 2014 would have been in the 75th percentile of production expenses in the third quarter of 2018, highlighting a broad reduction in production expenses among U.S. oil producers.
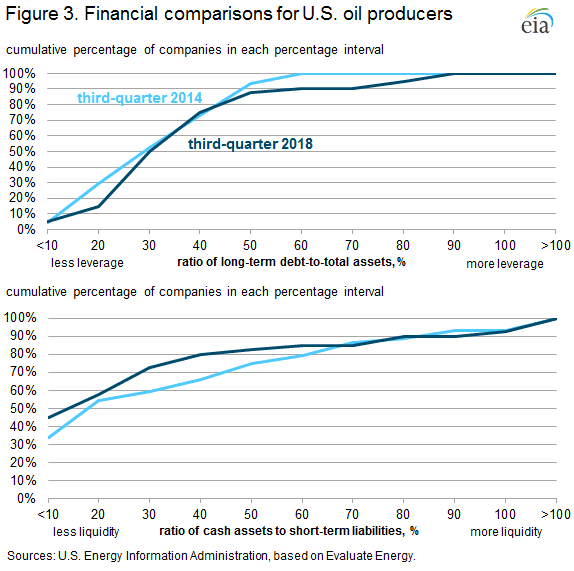
In contrast to the different operating environments of the two periods, measures of leverage (debt) and liquidity (ability to pay short-term liabilities quickly) do not appear to have significantly changed between 2014 and 2018. After the oil price decline of 2014, many companies restructured their balance sheets through debt consolidation, asset impairments, and asset sales. In the third quarters of 2014 and 2018, nearly all of the companies had long-term debt-to-asset ratios of less than 50%, meaning most of their assets were financed by the owners of the companies (Figure 3). Although no defined standard for an appropriate long-term debt-to-asset ratio for oil and natural gas production companies exists, the financial risk of inability to repay loans typically increases as the ratio increases. Alternatively, a ratio that is too low can indicate an inefficient use of resources available for investment.
Even though measures of leverage between the two periods are comparable, this group of U.S. oil producers has slightly different measures of liquidity in 2018 compared with 2014. In the third quarter of 2018, 80% of the companies had a ratio of cash assets to short-term liabilities of less than 40%, compared with 66% of companies with this ratio as of the third quarter of 2014. Similar to leverage ratios, no standard ratio is considered adequate, but a higher ratio indicates that a company has more ability to weather financial downturns.
An important caveat with comparative analysis of oil companies in two different periods is the survivor bias inherent in company selection. In this case, the U.S. Energy Information Administration (EIA) cannot assess a company’s financial position in 2018 if the company did not survive the 2014 price decline, either because the company restructured from bankruptcy, delisted from a public securities exchange, or closed entirely. Companies that survived the 2014 price decline may provide a more positive picture of the overall financial position of the oil industry in 2018. However, this possible bias could be small because many of the same companies reported in both periods.
As discussed recently in EIA’s Short-Term Energy Outlook and previous editions of This Week in Petroleum, price volatility and uncertainty remain high. The recent decision for countries inside and outside the Organization of the Petroleum Exporting Countries (OPEC) to reduce production levels could stabilize prices, but other supply factors or lower-than-expected demand could put further downward pressure on oil prices.