Oil Markets Remain Indecisive
- Oil prices trading in a $4 range since mid-July
- Bullish and bearish factors holding prices in place
- Broad economic indicators — unemployment, interest rates — are sending mixed messages too
- Natural gas supplies continue to build. Should test $2.00.

The Matrix
Oil futures have traded in a tight range since mid-June. WTI crude oil ranged around $7.35 during that time. Its range has been even tighter since July 18, something around $4.00. Lower trading volume in the September futures contract supports this view. (Even a Presidential Tweet on Chinese tariffs saw little follow through.)
Powerhouse has been following the narrowing range of oil prices in recent months. Bullish factors include constrained output in Venezuela and Iran. OPEC+ has reportedly followed its reduced production schedule. Shale oil producers in the United States, however, continue to supply oil. Steady, if incremental, improvements in pipeline delivery for export are a new factor in assessing global supply balances.
Oil prices could move in response to changes in the petroleum environment – movements in inventories or demand – or changes in the broader economy. Powerhouse monitors the petroleum situation routinely.
The general economy has its own set of statistics to watch. And ten years plus of economic expansion invites discussion of a potential downturn.
The unemployment rate is perhaps the most familiar economic statistic watched by the general public. It is currently very low. A rapidly rising unemployment rate could support the idea of an economic recession.
The yield curve – interest rates on government bonds over time – is another measure of the economy’s health. This curve has “inverted,” with long-term rates below short-term rates. Short-term rates higher than long-term rates suggest anxiety among investors, hence fears of a recession.
Other statistics also measure the health of the economy (and demand for petroleum.) They include the ISM Manufacturing Index and measures of consumer sentiment.
Measurement and statistics are at the heart of economic analysis. Powerhouse’s consideration of oil markets includes regular evaluation of economic statistics. These data contribute to our analyses and to our recommendations. They are valuable, but do not provide complete answers to the question of where (and especially when) an oil market might change direction.
What could turn this flat market into a trend? No one knows. That’s why oil dealers hedge. Some want to avoid the risk of buying/ committing to supply and facing a collapse in prices. Others defer buying and run into a sharp rally in prices, leaving them at a competitive disadvantage. Hedging reduces price volatility.
Supply/Demand Balances
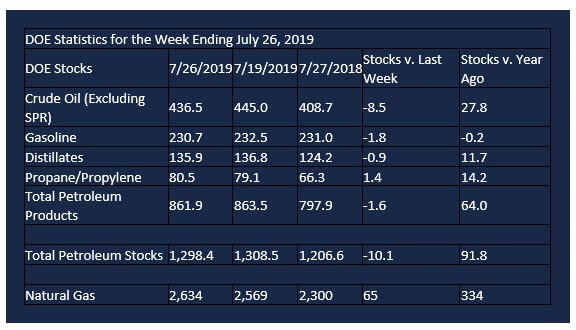
Supply/demand data in the United States for the week ending July 26, 2019, were released by the Energy Information Administration.
Total commercial stocks of petroleum fell 10.1 million barrels during the week ending July 26, 2019.
There were draws in stocks of gasoline, K-jet fuel, distillates, and residual fuel. There were builds in stocks of fuel ethanol, propane, and other oils.
Commercial crude oil supplies in the United States fell 8.5 million barrels from the previous report week to 436.5 million barrels.
Crude oil supplies decreased in all five of the five PAD Districts. PAD District 1 (East Coast) crude oil stocks declined 0.5 million barrels, PADD 2 (Midwest) stocks fell 0.9 million barrels, PADD 3 (Gulf Coast) crude stocks retreated 3.4 million barrels, PADD 4 (Rockies) stocks decreased 0.6 million barrels, and PADD 5 (West Coast) stocks declined 3.0 million barrels.
Cushing, Oklahoma inventories fell 1.5 million barrels from the previous report week to 48.9 million barrels.
Domestic crude oil production rose 900,000 barrels per day from the previous report week to 12.2 million barrels daily.
Crude oil imports averaged 6.663 million barrels per day, a daily decrease of 365,000 barrels. Exports declined 718,000 barrels daily to 2.574 million barrels per day.
Refineries used 93.0 percent of capacity, down 0.1% from the previous report week.
Crude oil inputs to refineries decreased 43,000 barrels daily; there were 16.991 million barrels per day of crude oil run to facilities. Gross inputs, which include blending stocks, fell 24,000 barrels daily to 17.484 million barrels daily.
Total petroleum product inventories fell 1.6 million barrels from the previous report week.
Gasoline stocks decreased 1.8 million barrels daily from the previous report week; total stocks are 230.7 million barrels.
Demand for gasoline fell 115,000 barrels per day to 9.559 million barrels per day.
Total product demand decreased 287,000 barrels daily to 21.296 million barrels per day.
Distillate fuel oil stocks decreased 0.9 million barrels from the previous report week; distillate stocks are at 135.9 million barrels. EIA reported national distillate demand at 3.885 million barrels per day during the report week, a decrease of 379,000 barrels daily.
Propane stocks increased 1.4 million barrels from the previous report week; propane stocks are 80.5 million barrels. The report estimated current demand at 1.141 million barrels per day, an increase of 308,000 barrels daily from the previous report week.
Natural Gas
Natural gas futures have been moving steadily lower since mid-July when they topped at $2.49. By month-end, prices had fallen to $2.11 creating an oversold condition inviting buying and short covering. The subsequent recovery added about $0.22 to value in two trading sessions, but the Presidential Tweet announcing additional tariffs on China brought futures markets well off their highs, in fact registering a new low of $2.077 as the week ended.
Underground storage shows building supplies. The latest report shows stocks 14.5 per cent greater than last year at this time and 4.5 per cent less than the average of the past five years. The rally, although brief, showed buying interest remains for natural gas. Clarity awaits more data.
According to the Energy Information Administration:
Net injections into storage totaled 65 Bcf for the week ending July 26, compared with the five-year (2014–18) average net injections of 37 Bcf and last year’s net injections of 31 Bcf during the same week. Working gas stocks totaled 2,634 Bcf, which is 123 Bcf lower than the five-year average and 334 Bcf more than last year at this time.
The average rate of net injections into storage is 34% higher than the five-year average so far in the refill season (April through October). If the rate of injections into storage matched the five-year average of 9.6 Bcf/d for the remainder of the refill season, total inventories would be 3,569 Bcf on October 31, which is 123 Bcf lower than the five-year average of 3,692 Bcf for that time of year.
Futures trading involves significant risk and is not suitable for everyone. Transactions in securities futures, commodity and index futures and options on future markets carry a high degree of risk. The amount of initial margin is small relative to the value of the futures contract, meaning that transactions are heavily “leveraged”. A relatively small market movement will have a proportionately larger impact on the funds you have deposited or will have to deposit: this may work against you as well as for you. You may sustain a total loss of initial margin funds and any additional funds deposited with the clearing firm to maintain your position. If the market moves against your position or margin levels are increased, you may be called upon to pay substantial additional funds on short notice to maintain your position. If you fail to comply with a request for additional funds within the time prescribed, your position may be liquidated at a loss and you will be liable for any resulting deficit. Past performance may not be indicative of future results. This is not an offer to invest in any investment program.
Powerhouse is a registered affiliate of Coquest, Inc.
Was this helpful? We’d like your feedback.
Please respond to [email protected]
Copyright© 2019 Powerhouse, All rights reserved.


