ULSD Prices are Strong; Little Help From Other Energy Futures
- ULSD futures price up 20% since early August
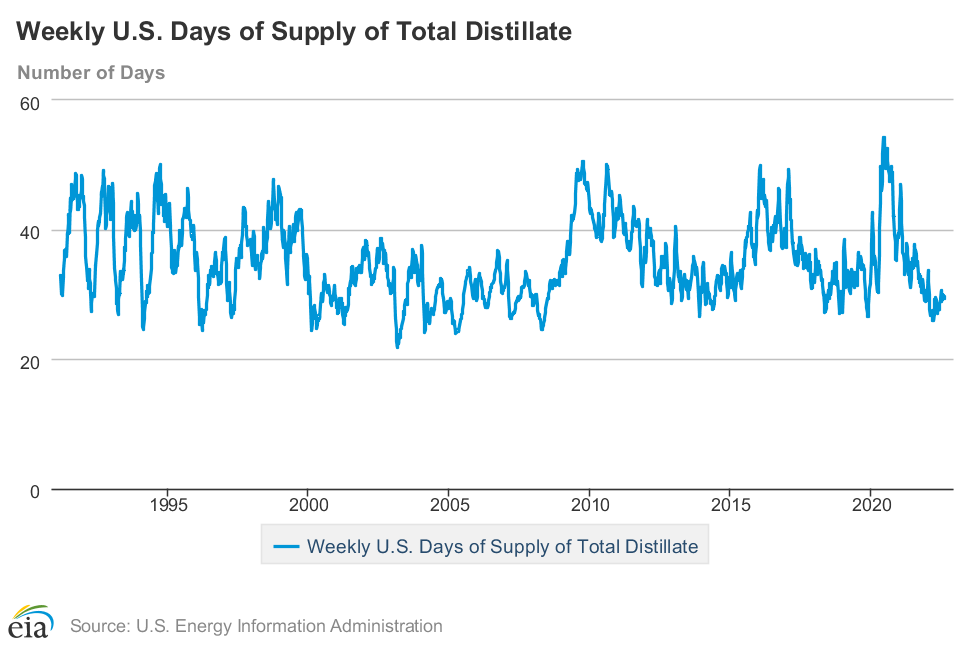
- Distillate fuel inventory remains below low of five-year supply level
- Atlantic hurricane season remarkably quiet so far.
- The average rate of injections into storage is 7% lower than the five-year average so far in this refill season.
Sincerely,
Alan Levine, Chairman
Powerhouse
(202) 333-5380
The Matrix
August arrives at the end of summer with a mixed message of strength developing in diesel fuel oil and lack of direction for WTI and RBOB futures. The week ended August 19 saw ULSD futures reach $3.74, a new high for the contract since August 8, when futures bottomed at $3.14.
It’s tempting to call this 20% gain the start of the fall rally. Resistance at $3.81 is only a few cents away. If pierced, a new objective at $4.65 is not unrealistically far away.
ULSD fundamentals support this view. The most recent DOE U.S. Petroleum Balance as of August 12 shows 112.3 million barrels of distillate fuel oil in storage. This is only modestly above levels at which serious supply concerns are raised, especially going into winter. Distillate supply has remained stubbornly below the low storage level of the past five years.

There are now 29.4 days of distillate supply in tank, slightly higher than at the end of the winter heating season. This is well below recent years. In June of 2020, the United States had more than 51 day’s supply, a record reaching back into the early 1990’s.
The data for distillate fuel oils are bullish. Supplies are tight and winter stocking is upon us. Nonetheless, energy futures generally trade in unison. But this does not seem to be the case just now. Both WTI and RBOB futures have been trading flat over the past several weeks.
RBOB is in its last month of summer specifications and is concerned mostly with weather events (or refinery problems) for volatility. And this year, the hurricane season has been very quiet. The Washington Post reported on August 19 that the Atlantic basin hasn’t seen a hurricane in an impressive 317 days.
“This year has now entered into the top 10 years with the longest dearth of hurricanes in the satellite record,” according to The Washington Post’s Capital Weather Gang. But the weather guys are still expecting storms to develop.
Crude oil prices are flat as well. Implementation of a new Iranian nuclear deal is on the table. It would be bearish for prices. Extended battle in Ukraine will continue to have bullish ramifications.
Supply/Demand Balances
Supply/demand data in the United States for the week ended August 12, 2022, were released by the Energy Information Administration.
Total commercial stocks of petroleum fell 9.2 million barrels during the week ended August 12, 2022.
Commercial crude oil supplies in the United States decreased by 7.1 million barrels from the previous report week to 425.0 million barrels.
Crude oil inventory changes by PAD District:
PADD 1: UNCH at 7.9 million barrels
PADD 2: Down 0.3 million barrels to 108.5 million barrels
PADD 3: Down 7.5 million barrels to 234.9 million barrels
PADD 4: Down 0.2 million barrels to 23.3 million barrels
PADD 5: Plus 0.9 million barrels to 50.4 million barrels
Cushing, Oklahoma, inventories were up 0.2 million barrels from the previous report week to 25.4 million barrels.
Domestic crude oil production was down 100,000 barrels per day from the previous report week to 12.1 million barrels daily.
Crude oil imports averaged 6.132 million barrels per day, a daily decrease of 39,000 barrels. Exports increased 2,890,000 barrels daily to 5.0 million barrels per day.
Refineries used 93.5% of capacity; 0.8 percentage points lower than the previous report week.
Crude oil inputs to refineries decreased 158,000 barrels daily; there were 16.423 million barrels per day of crude oil run to facilities. Gross inputs, which include blending stocks, fell 133,000 barrels daily to 16.783 million barrels daily.
Total petroleum product inventories rose by 1.3 million barrels from the previous report week, rising to 791.1 million barrels.
Total product demand increased 1,747,000 barrels daily to 21.221 million barrels per day.
Gasoline stocks decreased 4.6 million barrels from the previous report week; total stocks are 215.7 million barrels.
Demand for gasoline rose 225,000 barrels per day to 9.348 million barrels per day.
Distillate fuel oil stocks increased 0.8 million barrels from the previous report week; distillate stocks are at 112.3 million barrels. EIA reported national distillate demand at 3.925 million barrels per day during the report week, a increase of 200,000 barrels daily.
Propane stocks were up 2.3 million barrels from the previous report week to 68.0 million barrels. The report estimated current demand at 965,000 barrels per day, an increase of 359,000 barrels daily from the previous report week.
Natural Gas
Injections are lagging the five-year average by 7%, potentially yielding a start-of-withdrawal level of 3.3 Tcf, 367 Bcf below the five-year average. This suggests tighter-than-normal natural gas availability, a bullish price indicator.
The Freeport Louisiana LNG export facility is expected to re-open in October. This could renew export capacity by 17%, materially increasing overseas markets adding upward pressure to price. Powerhouse has discussed the implications of growth in European demand several times in the past. The impact remains potentially strong.
Natural gas spot futures prices rose 28.6% during August. The monthly low of $7.53 per MMBtu, reached on August 8 rallied to $9.68 by August 17, when $9.68 was seen. Last week, the price settled at $9.34.
According to the EIA:
The net injections into storage totaled 41 Bcf for the week ended July 29, compared with the five-year (2017–2021) average net injections of 33 Bcf and last year’s net injections of 16 Bcf during the same week. Working natural gas stocks totaled 2,457 Bcf, which is 12%, or 337 Bcf, lower than the five-year average and 10%, or 268 Bcf, lower than last year at this time.
Net injections [of natural gas] into storage totaled 44 Bcf for the week ended August 5, compared with the five-year (2017–2021) average net injections of 45 Bcf and last year’s net injections of 44 Bcf during the same week. Working natural gas stocks totaled 2,501 Bcf, which is 338 Bcf (12%) lower than the five-year average and 268 Bcf (10%) lower than last year at this time. The average rate of injections into storage is 5% lower than the five-year average so far in the refill season (April through October). If the rate of injections into storage matched the five-year average of 9.3 Bcf/d for the remainder of the refill season, the total inventory would be 3,307 Bcf on October 31, which is 338 Bcf lower than the five-year average of 3,645 Bcf for that time of year.
Was this helpful? We’d like your feedback.
Please respond to [email protected]
Powerhouse Futures & Trading Disclaimer
Copyright 2022 Powerhouse Brokerage, LLC, All rights reserved