A New Mode of Behavior for U.S. Natural Gas Producers?
- No announcements yet from OPEC
- Chinese diesel demand weakens
- U.S. gasoline demand resilient
- U.S. natural gas producers attempting to combat low prices
Sincerely
David Thompson, CMT
Executive Vice President
Powerhouse
(202) 333-5380
The Matrix
The previous edition of the Weekly Energy Market Situation highlighted four factors that POWERHOUSE is monitoring. We update the status of these issues with an extended focus on natural gas.
OPEC has made no additional official comments on their planned production quotas.
Chinese diesel demand continues to be weak. On August 15th, news agencies reported that China’s June diesel demand fell by 11% year over year, the largest percentage drop since July 2021.
Last week’s DOE report showed U.S. refiners running 3.2% behind year ago levels. This is roughly the same as the previous reading.
U.S. gasoline demand was indicated at 2.2% ahead of year ago levels in the DOE report. This is an improvement of 0.7% over the prior reading.
Front-month RBOB and ULSD futures have tested (or broken) their prior significant low water marks from June 4th. The $2.25 – $2.30 levels remain key technical price zones for both contracts.
Supply/Demand Balances
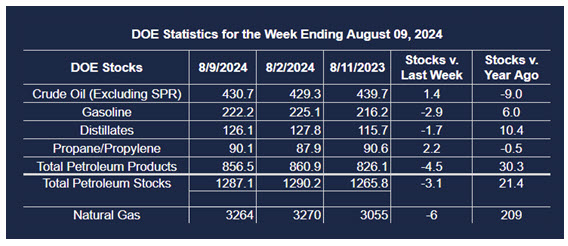
Supply/demand data in the United States for the week ended August 9, 2024, were released by the Energy Information Administration.
Total commercial stocks of petroleum decreased (⬇) 3.1 million barrels to 1.2871 billion barrels during the week ended August 9th, 2024.
Commercial crude oil supplies in the United States were higher (⬆) by 1.4 million barrels from the previous report week to 430.7 million barrels.
Crude oil inventory changes by PAD District:
PADD 1: Down (⬇) 0.2 million barrels to 8.6 million barrels
PADD 2: Down (⬇) 2.6 million barrels to 108.1 million barrels
PADD 3: Up (⬆) 5.6 million barrels to 243.9 million barrels
PADD 4: Up (⬆) 0.1 million barrels to 22.9 million barrels
PADD 5: Down (⬇) 1.5 million barrels to 47.2 million barrels
Cushing, Oklahoma, inventories were down (⬇) 1.6 million barrels to 28.8 million barrels.
Domestic crude oil production decreased by 100,000 barrels (⬇) to 13.3 million barrels per day.
Crude oil imports averaged 6.285 million barrels per day, a daily increase (⬆) of 61,000 barrels. Exports increased (⬆) 118,000 barrels daily to 3.756 million barrels per day.
Refineries used 91.5% of capacity; 1.0 percentage point more (⬆) than the previous report week.
Crude oil inputs to refineries increased (⬆) 65,000 barrels daily; there were 16.467 million barrels per day of crude oil run to facilities. Gross inputs, which include blending stocks, increased (⬆) 176,000 barrels daily to 16.761 million barrels daily.
Total petroleum product inventories decreased (⬇) by 4.4 million barrels from the previous report week, down to 856.5 million barrels.
Total product demand increased (⬆) 550,000 barrels daily to 20.523 million barrels per day.
Gasoline stocks decreased (⬇) 2.9 million barrels from the previous report week; total stocks are 222.2 million barrels.
Demand for gasoline increased (⬆) 78,000 barrels per day to 9.045 million barrels per day.
Distillate fuel oil stocks decreased (⬇) 1.7 million barrels from the previous report week; distillate stocks are at 126.1 million barrels. EIA reported national distillate demand at 3.549 million barrels per day during the report week, an increase (⬆) of 79,000 barrels daily.
Propane stocks rose (⬆) 2.2 million barrels from the previous report to 90.1 million barrels. The report estimated current demand at 867,000 barrels per day, a decrease (⬇) of 165,000 barrels daily from the previous report week.
Natural Gas
Last week’s discussion of the behavior crude oil producers and refiners is a useful filter through which to examine the actions of natural gas producers. Until recently, natural gas producers had maximized output with seemingly little concern for price. A warm start to the winter of 23/24 saw natural gas demand fall off, yet producers hit a daily output record of 105 billion cubic feet. Unsurprisingly, bearish price sentiment developed as inventories swelled.
In April, some natural gas producers changed tactics and announced reductions in planned output in the face of low prices. These actions spurred a six-week rally in price before natural gas output started to climb once again.
In recent days, major natural gas producers have announced a second round of production curtailments this year. This new producer behavior – reacting much more quickly to market prices – could be a major sea change for natural gas pricing if it becomes a regular pattern.
POWERHOUSE will add ‘U.S. natural gas producer output announcements’ to our list of key factors to monitor.
According to the EIA:
- Net withdrawals from storage totaled 6 Bcf for the week ended August 9, compared with the five-year (2019–2023) average net injections of 43 Bcf and last year’s net injections of 33 Bcf during the same week. Working natural gas stocks totaled 3,264 Bcf, which is 375 Bcf (13%) more than the five-year average and 209 Bcf (7%) more than last year at this time.
- According to The Desk survey of natural gas analysts, estimates of the weekly net change to working natural gas stocks ranged from net withdrawals of 12 Bcf to net injections of 23 Bcf, with a median estimate of net withdrawals of 2 Bcf.
- The average rate of injections into storage is 21% lower than the five-year average so far in the refill season (April through October). If the rate of injections into storage matched the five-year average of 9.9 Bcf/d for the remainder of the refill season, the total inventory would be 4,087 Bcf on October 31, which is 375 Bcf higher than the five-year average of 3,712 Bcf for that time of year.
Was this helpful? We’d like your feedback.
Please respond to [email protected]
This material has been prepared by a sales or trading employee or agent of Powerhouse Brokers, LLC and is, or is in the nature of, a solicitation. This material is not a research report prepared by Powerhouse Brokers, LLC. By accepting this communication, you agree that you are an experienced user of the futures markets, capable of making independent trading decisions, and agree that you are not, and will not, rely solely on this communication in making trading decisions.
DISTRIBUTION IN SOME JURISDICTIONS MAY BE PROHIBITED OR RESTRICTED BY LAW. PERSONS IN POSSESSION OF THIS COMMUNICATION INDIRECTLY SHOULD INFORM THEMSELVES ABOUT AND OBSERVE ANY SUCH PROHIBITION OR RESTRICTIONS. TO THE EXTENT THAT YOU HAVE RECEIVED THIS COMMUNICATION INDIRECTLY AND SOLICITATIONS ARE PROHIBITED IN YOUR JURISDICTION WITHOUT REGISTRATION, THE MARKET COMMENTARY IN THIS COMMUNICATION SHOULD NOT BE CONSIDERED A SOLICITATION.
The risk of loss in trading futures and/or options is substantial and each investor and/or trader must consider whether this is a suitable investment. Past performance, whether actual or indicated by simulated historical tests of strategies, is not indicative of future results. Trading advice is based on information taken from trades and statistical services and other sources that Powerhouse Brokers, LLC believes are reliable. We do not guarantee that such information is accurate or complete and it should not be relied upon as such. Trading advice reflects our good faith judgment at a specific time and is subject to change without notice. There is no guarantee that the advice we give will result in profitable trades.
Copyright 2024 Powerhouse Brokers, LLC, All rights reserved