Bullish Oil Expectations Face COVID-19 Barriers
- Oil futures trendless
- RBOB inventories are very tight
- Increased hurricane activity predicted
- Natural gas price looking higher

Alan Levine—Chairman, Powerhouse
(202) 333-5380
The Matrix
Oil prices failed to establish a trend in the week ended August 6. ULSD prices have been essentially flat since early May, trading around $2.25 per gallon. Similar patterns have constrained RBOB and WTI.
RBOB trading also centered around $2.25. Gasoline demand reached 9.8 million barrels daily last week, a gain of 450,000 barrels per day for the week. This is close to the record high of over 10 million barrels per day demand posted recently.
RBOB supplies are unusually tight—another bullish indicator. There are only 229 million barrels of gasoline in storage according to the EIA’s weekly supply balance report, about one thousand barrels more than the five-year low.
Weather is always a petroleum industry consideration. We are now in the 2021 Hurricane season. NOAA has issued a revised forecast, increasing the number of expected hurricanes this year to 21.
The industry has been concerned with the impact on refineries of Gulf Coast hurricanes in the past. Gulf Coast refineries have been hardened since Hurricane Katrina, but drivers and shortages of fuel remain a challenge, depending on the impact on roads.
The global impact of geopolitical events is almost always reflected in crude oil prices. There is no dearth of market-moving events now. Tunisia is in turmoil, as is Libya.
Most immediately, an oil tanker was attacked in the Arabian Sea. The vessel was Liberian flagged, owned by Japanese interests and managed by a London-based group. The United States has named Iran as the attacker. There has since been no retaliation, and oil markets have not reacted. Such an event would typically lead to a rally.
Analysts point to the delta variant that is now the focus of the pandemic. (A newer variant, lambda, is showing high transmissibility and resistance to the vaccine.) Risk aversion is slowing price action in several commodity markets. In that light, the failure to respond to a tanker attack may make more sense.
Supply/Demand Balances
Supply/demand data in the United States for the week ended July 30, 2021, were released by the Energy Information Administration.
Total commercial stocks of petroleum fell 1.2 million barrels during the week ended July 30, 2021.
Commercial crude oil supplies in the United States increased by 3.6 million barrels from the previous report week to 439.2 million barrels.
Crude oil inventory changes by PAD District:
PADD 1: Down 0.5 to 8.8 million barrels
PADD 2: Down 0.3 million barrels to 118.3 million barrels
PADD 3: Plus 3.1 million barrels to 241.7 million barrels
PADD 4: Down 0.2 million barrels to 23.7 million barrels
PADD 5: Plus 1.4 million barrels to 46.6 million barrels
Cushing, Oklahoma, inventories were down 0.5 million barrels from the previous report week to 34.9 million barrels.
Domestic crude oil production was unchanged from the previous report week at 11.2 million barrels daily.
Crude oil imports averaged 6.432 million barrels per day, a daily decrease of 75,000 barrels. Exports decreased 585,000 barrels daily to 1.904 million barrels per day.
Refineries used 91.3% of capacity; 0.2 percentage points lower from the previous report week.
Crude oil inputs to refineries increased 45,000 barrels daily; there were 16.545 million barrels per day of crude oil run to facilities.
Gross inputs, which include blending stocks, rose 30,000 barrels daily to 16.569 million barrels daily.
Total petroleum product inventories fell 4.8 million barrels from the previous report week.
Gasoline stocks decreased 5.3 million barrels commercial crude oil supplies in the United States increased by 3.6 million barrels from the previous report week to 439.2 million barrels.
Demand for gasoline rose 451,000 barrels per day to 9.775 million barrels per day.
Total product demand increased 45,000 barrels daily to 21.168 million barrels per day.
Distillate fuel oil stocks rose 0.8 million barrels from the previous report week; distillate stocks are at 138.7 million barrels. EIA reported national distillate demand at 3.618 million barrels per day during the report week, a decrease of 737,000 barrels daily.
Propane stocks rose 1.5 million barrels from the previous report week; propane stocks are at 66 million barrels. The report estimated current demand at 956,000 barrels per day, an increase of 334,000 barrels daily from the previous report week.
Natural Gas
Natural gas futures bottomed at $1.43 late in June 2021. Spot futures have since more than doubled, moving well above $4/MMBtus.
A natural gas price index shows the average annual natural gas price variation, based on data from 2009 through 2020. The pre-season price tends to start its winter climb in August, topping in November. The average increase over this period is around 17%, suggesting a possible winter objective of $4.68. An Elliott Wave count supports this view, with a completed third wave around that level.
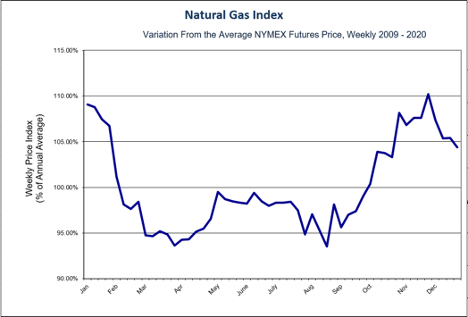
Natural Gas – Annual Price Trend 2009 – 2020 Source: Powerhouse, CME
According to the EIA:
The net injections into [natural gas] storage totaled 13 Bcf for the week ended July 30, compared with the five-year (2016–20) average net injections of 30 Bcf and last year’s net injections of 32 Bcf during the same week. Working natural gas stocks totaled 2,727 Bcf, which is 185 Bcf lower than the five-year average and 542 Bcf lower than last year at this time.
The average rate of injections into storage is 14% lower than the five-year average so far in the refill season (April through October). If the rate of injections into storage matched the five-year average of 8.7 Bcf/d for the remainder of the refill season, the total inventory would be 3,534 Bcf on October 31, which is 185 Bcf lower than the five-year average of 3,719 Bcf for that time of year.
Was this helpful? We’d like your feedback.
Please respond to [email protected]
Powerhouse Futures & Trading Disclaimer
Copyright 2021 Powerhouse Brokerage, LLC, All rights reserved